
|
Viel & CIE, Société Anonyme (Vil.PA) Valoración de DCF |
Completamente Editable: Adáptelo A Sus Necesidades En Excel O Sheets
Diseño Profesional: Plantillas Confiables Y Estándares De La Industria
Predeterminadas Para Un Uso Rápido Y Eficiente
Compatible con MAC / PC, completamente desbloqueado
No Se Necesita Experiencia; Fáciles De Seguir
VIEL & Cie, SA (VIL.PA) Bundle
Diseñada para la precisión, nuestra calculadora DCF (VILPA) le permite evaluar VIEL & CIE, la valoración de Société Anonyme utilizando datos financieros del mundo real, que ofrece una flexibilidad completa para modificar todos los parámetros esenciales para las proyecciones mejoradas.
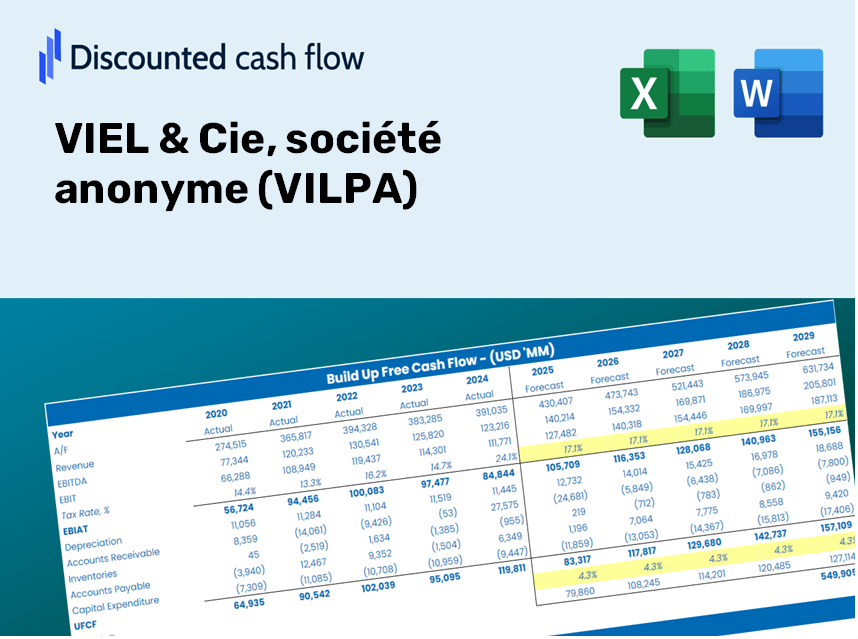
Discounted Cash Flow (DCF) - (USD MM)
| Year | AY1 2020 |
AY2 2021 |
AY3 2022 |
AY4 2023 |
AY5 2024 |
FY1 2025 |
FY2 2026 |
FY3 2027 |
FY4 2028 |
FY5 2029 |
|---|---|---|---|---|---|---|---|---|---|---|
| Revenue | 891.2 | 869.9 | 1,009.2 | 1,080.2 | 1,161.5 | 1,243.4 | 1,331.0 | 1,424.8 | 1,525.2 | 1,632.7 |
| Revenue Growth, % | 0 | -2.39 | 16.02 | 7.03 | 7.53 | 7.05 | 7.05 | 7.05 | 7.05 | 7.05 |
| EBITDA | 113.1 | 102.4 | 127.3 | 156.6 | 181.8 | 167.2 | 179.0 | 191.6 | 205.1 | 219.5 |
| EBITDA, % | 12.69 | 11.77 | 12.62 | 14.5 | 15.65 | 13.45 | 13.45 | 13.45 | 13.45 | 13.45 |
| Depreciation | 29.9 | 27.9 | 30.0 | 27.8 | 28.5 | 36.2 | 38.8 | 41.5 | 44.4 | 47.6 |
| Depreciation, % | 3.36 | 3.21 | 2.97 | 2.57 | 2.45 | 2.91 | 2.91 | 2.91 | 2.91 | 2.91 |
| EBIT | 83.2 | 74.5 | 97.4 | 128.8 | 153.3 | 131.0 | 140.2 | 150.1 | 160.6 | 172.0 |
| EBIT, % | 9.33 | 8.56 | 9.65 | 11.93 | 13.2 | 10.53 | 10.53 | 10.53 | 10.53 | 10.53 |
| Total Cash | 385.2 | 540.9 | 486.0 | 524.9 | 657.0 | 643.3 | 688.7 | 737.2 | 789.2 | 844.8 |
| Total Cash, percent | .0 | .0 | .0 | .0 | .0 | .0 | .0 | .0 | .0 | .0 |
| Account Receivables | 1,557.3 | 2,107.0 | 1,653.4 | 1,586.0 | 1,581.6 | 1,243.4 | 1,331.0 | 1,424.8 | 1,525.2 | 1,632.7 |
| Account Receivables, % | 174.75 | 242.22 | 163.83 | 146.84 | 136.17 | 100 | 100 | 100 | 100 | 100 |
| Inventories | .0 | .0 | .0 | .0 | .0 | .0 | .0 | .0 | .0 | .0 |
| Inventories, % | 0 | 0 | 0 | 0 | 0 | 0 | 0 | 0 | 0 | 0 |
| Accounts Payable | 1,278.4 | 1,796.5 | 1,349.1 | 1,259.3 | 1,225.4 | 1,243.4 | 1,331.0 | 1,424.8 | 1,525.2 | 1,632.7 |
| Accounts Payable, % | 143.45 | 206.53 | 133.67 | 116.59 | 105.5 | 100 | 100 | 100 | 100 | 100 |
| Capital Expenditure | -10.0 | -9.5 | -9.2 | -9.0 | -12.8 | -12.6 | -13.5 | -14.4 | -15.4 | -16.5 |
| Capital Expenditure, % | -1.12 | -1.1 | -0.90853 | -0.83387 | -1.1 | -1.01 | -1.01 | -1.01 | -1.01 | -1.01 |
| Tax Rate, % | 41.12 | 41.12 | 41.12 | 41.12 | 41.12 | 41.12 | 41.12 | 41.12 | 41.12 | 41.12 |
| EBITAT | 47.2 | 42.2 | 54.8 | 75.9 | 90.3 | 75.3 | 80.6 | 86.3 | 92.4 | 98.9 |
| Depreciation | ||||||||||
| Changes in Account Receivables | ||||||||||
| Changes in Inventories | ||||||||||
| Changes in Accounts Payable | ||||||||||
| Capital Expenditure | ||||||||||
| UFCF | -211.9 | 29.1 | 81.8 | 72.3 | 76.5 | 455.1 | 105.9 | 113.4 | 121.4 | 129.9 |
| WACC, % | 4.09 | 4.09 | 4.08 | 4.11 | 4.11 | 4.1 | 4.1 | 4.1 | 4.1 | 4.1 |
| PV UFCF | ||||||||||
| SUM PV UFCF | 845.2 | |||||||||
| Long Term Growth Rate, % | 2.00 | |||||||||
| Free cash flow (T + 1) | 133 | |||||||||
| Terminal Value | 6,323 | |||||||||
| Present Terminal Value | 5,173 | |||||||||
| Enterprise Value | 6,018 | |||||||||
| Net Debt | -46 | |||||||||
| Equity Value | 6,064 | |||||||||
| Diluted Shares Outstanding, MM | 67 | |||||||||
| Equity Value Per Share | 89.98 |
What You Will Receive
- Authentic VILPA Financial Data: Pre-loaded with VIEL & Cie’s historical and forecasted figures for accurate evaluations.
- Completely Customizable Template: Easily adjust essential parameters such as revenue growth, WACC, and EBITDA percentage.
- Instant Calculations: Watch VIEL & Cie’s intrinsic value refresh immediately as you make adjustments.
- Expert Valuation Tool: Crafted for investors, analysts, and consultants pursuing precise DCF outcomes.
- User-Centric Design: Intuitive layout and straightforward guidance suitable for all skill levels.
Key Features
- 🔍 Real-Life VIEL & Cie Financials: Pre-filled historical and projected data for VIEL & Cie (VILPA).
- ✏️ Fully Customizable Inputs: Modify all essential parameters (yellow cells) such as WACC, growth %, and tax rates.
- 📊 Professional DCF Valuation: Integrated formulas calculate VIEL & Cie’s intrinsic value using the Discounted Cash Flow method.
- ⚡ Instant Results: Immediately visualize VIEL & Cie’s valuation after making adjustments.
- Scenario Analysis: Evaluate and compare results for different financial assumptions side-by-side.
How It Works
- Step 1: Download the prebuilt Excel template featuring VIEL & Cie's (VILPA) data.
- Step 2: Review the pre-populated sheets to familiarize yourself with the essential metrics.
- Step 3: Modify forecasts and inputs in the editable yellow cells (WACC, growth, margins).
- Step 4: Instantly observe the updated results, including VIEL & Cie's intrinsic value.
- Step 5: Use the outputs to make well-informed investment choices or create detailed reports.
Why Opt for the VIEL & Cie (VILPA) Calculator?
- Reliable Data: Utilize authentic VIEL & Cie financial figures for trustworthy valuation outcomes.
- Tailor-Made: Modify essential parameters such as growth rates, WACC, and tax rates to align with your forecasts.
- Efficiency: Built-in calculations save you the hassle of starting from the ground up.
- Professional-Quality Tool: Crafted for investors, analysts, and consultants.
- Accessible Interface: User-friendly design and clear, guided instructions ensure ease of use for everyone.
Who Can Benefit from VIEL & Cie (VILPA)?
- Investors: Make informed choices with our advanced valuation tools tailored for precision.
- Financial Analysts: Enhance efficiency with our customizable pre-built DCF models at your disposal.
- Consultants: Easily modify templates for impactful client presentations or insightful reports.
- Finance Enthusiasts: Expand your knowledge of valuation strategies through real-world case studies.
- Educators and Students: Utilize our resources as effective learning aids in finance-related studies.
Contents of the Template
- Pre-Filled Data: Contains VIEL & Cie's historical financials and projections.
- Discounted Cash Flow Model: A customizable DCF valuation model featuring automatic calculations.
- Weighted Average Cost of Capital (WACC): A separate sheet for calculating WACC using custom parameters.
- Key Financial Ratios: Evaluate VIEL & Cie's profitability, efficiency, and leverage metrics.
- Customizable Inputs: Easily modify revenue growth, margins, and tax rates.
- User-Friendly Dashboard: Visual representations and tables summarizing essential valuation results.
Disclaimer
All information, articles, and product details provided on this website are for general informational and educational purposes only. We do not claim any ownership over, nor do we intend to infringe upon, any trademarks, copyrights, logos, brand names, or other intellectual property mentioned or depicted on this site. Such intellectual property remains the property of its respective owners, and any references here are made solely for identification or informational purposes, without implying any affiliation, endorsement, or partnership.
We make no representations or warranties, express or implied, regarding the accuracy, completeness, or suitability of any content or products presented. Nothing on this website should be construed as legal, tax, investment, financial, medical, or other professional advice. In addition, no part of this site—including articles or product references—constitutes a solicitation, recommendation, endorsement, advertisement, or offer to buy or sell any securities, franchises, or other financial instruments, particularly in jurisdictions where such activity would be unlawful.
All content is of a general nature and may not address the specific circumstances of any individual or entity. It is not a substitute for professional advice or services. Any actions you take based on the information provided here are strictly at your own risk. You accept full responsibility for any decisions or outcomes arising from your use of this website and agree to release us from any liability in connection with your use of, or reliance upon, the content or products found herein.