
|
PERSONAJE. Industries Limited (Vipind.NS) Valoración de DCF |
Completamente Editable: Adáptelo A Sus Necesidades En Excel O Sheets
Diseño Profesional: Plantillas Confiables Y Estándares De La Industria
Predeterminadas Para Un Uso Rápido Y Eficiente
Compatible con MAC / PC, completamente desbloqueado
No Se Necesita Experiencia; Fáciles De Seguir
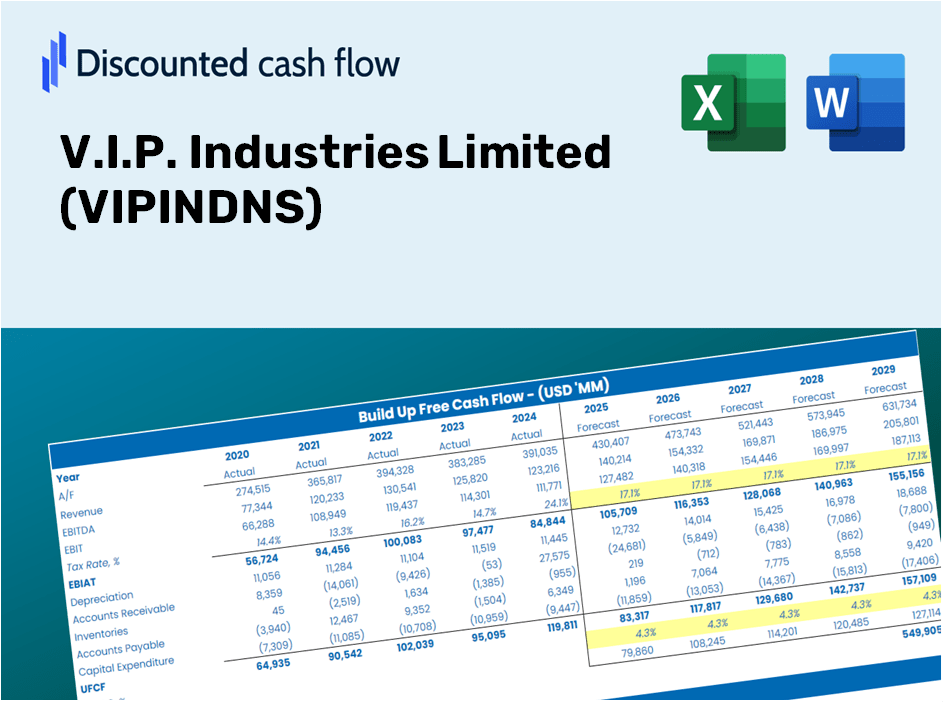
V.I.P. Industries Limited (VIPIND.NS) Bundle
Descubra el verdadero potencial de V.I.P. Industries Limited (VIPINDNS) con nuestra calculadora DCF avanzada! Ajuste los supuestos esenciales, explore varios escenarios y evalúe cómo influyen las modificaciones en la valoración de V.I.P. Industries Limited (VIPINDNS): todo dentro de una conveniente plantilla de Excel.
Discounted Cash Flow (DCF) - (USD MM)
| Year | AY1 2021 |
AY2 2022 |
AY3 2023 |
AY4 2024 |
AY5 2025 |
FY1 2026 |
FY2 2027 |
FY3 2028 |
FY4 2029 |
FY5 2030 |
|---|---|---|---|---|---|---|---|---|---|---|
| Revenue | 6,171.9 | 12,869.2 | 20,823.2 | 22,378.2 | 21,647.4 | 30,631.5 | 43,344.3 | 61,333.0 | 86,787.5 | 122,806.2 |
| Revenue Growth, % | 0 | 108.51 | 61.81 | 7.47 | -3.27 | 41.5 | 41.5 | 41.5 | 41.5 | 41.5 |
| EBITDA | -171.2 | 1,823.1 | 3,013.8 | 2,223.5 | 822.9 | 2,426.2 | 3,433.1 | 4,858.0 | 6,874.1 | 9,727.0 |
| EBITDA, % | -2.77 | 14.17 | 14.47 | 9.94 | 3.8 | 7.92 | 7.92 | 7.92 | 7.92 | 7.92 |
| Depreciation | 778.2 | 698.4 | 735.4 | 993.6 | 1,190.6 | 1,930.2 | 2,731.3 | 3,864.9 | 5,468.9 | 7,738.6 |
| Depreciation, % | 12.61 | 5.43 | 3.53 | 4.44 | 5.5 | 6.3 | 6.3 | 6.3 | 6.3 | 6.3 |
| EBIT | -949.4 | 1,124.7 | 2,278.4 | 1,229.9 | -367.7 | 496.0 | 701.8 | 993.1 | 1,405.2 | 1,988.4 |
| EBIT, % | -15.38 | 8.74 | 10.94 | 5.5 | -1.7 | 1.62 | 1.62 | 1.62 | 1.62 | 1.62 |
| Total Cash | 2,270.0 | 579.8 | 556.1 | 445.5 | 481.1 | 2,951.0 | 4,175.7 | 5,908.7 | 8,360.9 | 11,830.8 |
| Total Cash, percent | .0 | .0 | .0 | .0 | .0 | .0 | .0 | .0 | .0 | .0 |
| Account Receivables | 1,555.1 | 2,192.4 | 2,555.7 | 3,275.6 | 3,683.4 | 5,278.3 | 7,469.0 | 10,568.8 | 14,955.0 | 21,161.6 |
| Account Receivables, % | 25.2 | 17.04 | 12.27 | 14.64 | 17.02 | 17.23 | 17.23 | 17.23 | 17.23 | 17.23 |
| Inventories | 3,016.5 | 5,183.8 | 5,871.1 | 9,156.6 | 6,984.2 | 11,672.5 | 16,516.9 | 23,371.7 | 33,071.5 | 46,796.9 |
| Inventories, % | 48.87 | 40.28 | 28.19 | 40.92 | 32.26 | 38.11 | 38.11 | 38.11 | 38.11 | 38.11 |
| Accounts Payable | 1,540.3 | 2,823.9 | 3,021.3 | 4,069.0 | 3,863.2 | 5,969.3 | 8,446.8 | 11,952.3 | 16,912.8 | 23,932.0 |
| Accounts Payable, % | 24.96 | 21.94 | 14.51 | 18.18 | 17.85 | 19.49 | 19.49 | 19.49 | 19.49 | 19.49 |
| Capital Expenditure | -91.2 | -364.6 | -1,069.4 | -1,000.2 | -431.3 | -974.6 | -1,379.1 | -1,951.4 | -2,761.3 | -3,907.3 |
| Capital Expenditure, % | -1.48 | -2.83 | -5.14 | -4.47 | -1.99 | -3.18 | -3.18 | -3.18 | -3.18 | -3.18 |
| Tax Rate, % | 24.59 | 24.59 | 24.59 | 24.59 | 24.59 | 24.59 | 24.59 | 24.59 | 24.59 | 24.59 |
| EBITAT | -742.8 | 873.7 | 1,766.1 | 872.1 | -277.3 | 376.7 | 533.0 | 754.3 | 1,067.3 | 1,510.2 |
| Depreciation | ||||||||||
| Changes in Account Receivables | ||||||||||
| Changes in Inventories | ||||||||||
| Changes in Accounts Payable | ||||||||||
| Capital Expenditure | ||||||||||
| UFCF | -3,087.1 | -313.5 | 578.9 | -2,092.2 | 2,040.8 | -2,844.8 | -2,672.3 | -3,781.3 | -5,350.7 | -7,571.3 |
| WACC, % | 5.04 | 5.03 | 5.03 | 4.95 | 5 | 5.01 | 5.01 | 5.01 | 5.01 | 5.01 |
| PV UFCF | ||||||||||
| SUM PV UFCF | -18,727.9 | |||||||||
| Long Term Growth Rate, % | 4.00 | |||||||||
| Free cash flow (T + 1) | -7,874 | |||||||||
| Terminal Value | -779,715 | |||||||||
| Present Terminal Value | -610,640 | |||||||||
| Enterprise Value | -629,368 | |||||||||
| Net Debt | 7,032 | |||||||||
| Equity Value | -636,399 | |||||||||
| Diluted Shares Outstanding, MM | 142 | |||||||||
| Equity Value Per Share | -4,477.65 |
Benefits You Will Receive
- Modifiable Forecast Inputs: Adjust key variables (growth %, margins, WACC) effortlessly to explore various scenarios.
- Actual Market Data: V.I.P. Industries Limited's (VIPINDNS) financial information is readily available to facilitate your analysis.
- Instant DCF Calculations: The model automatically computes Net Present Value (NPV) and intrinsic value for your convenience.
- Tailored and Professional Design: A refined Excel template that can be customized to meet your valuation requirements.
- Designed for Analysts and Investors: Perfect for evaluating projections, confirming strategies, and maximizing efficiency.
Key Features
- Comprehensive DCF Calculator: Offers detailed unlevered and levered DCF valuation frameworks tailored for V.I.P. Industries Limited (VIPINDNS).
- WACC Calculator: Features a pre-formulated Weighted Average Cost of Capital sheet with adjustable parameters.
- Customizable Forecast Assumptions: Easily alter growth projections, capital expenditures, and discount rates to suit your analysis.
- Integrated Financial Ratios: Evaluate profitability, leverage, and efficiency ratios specifically for V.I.P. Industries Limited (VIPINDNS).
- Interactive Dashboard and Charts: Visual representations highlight key valuation metrics for streamlined analysis.
How It Works
- Step 1: Download the ready-to-use Excel template featuring V.I.P. Industries Limited (VIPINDNS) data.
- Step 2: Navigate through the pre-populated sheets to familiarize yourself with the essential metrics.
- Step 3: Modify the forecasts and assumptions in the editable yellow cells (WACC, growth, margins).
- Step 4: Instantly see the updated results, including the intrinsic value of V.I.P. Industries Limited (VIPINDNS).
- Step 5: Utilize the outputs to make informed investment decisions or create detailed reports.
Why Opt for This Calculator?
- Reliable Data: Authentic V.I.P. Industries Limited (VIPINDNS) financials guarantee trustworthy valuation outcomes.
- Tailored Options: Modify essential variables such as growth rates, WACC, and tax rates to align with your forecasts.
- Efficient: Pre-loaded calculations save you the effort of starting from the ground up.
- Expert-Quality Tool: Crafted specifically for investors, analysts, and consultants.
- Easy to Use: User-friendly design and guided instructions make it accessible for everyone.
Who Can Benefit from This Product?
- Individual Investors: Make well-informed choices when buying or selling V.I.P. Industries Limited (VIPINDNS) stock.
- Financial Analysts: Optimize valuation workflows with ready-made financial models tailored for VIPINDNS.
- Consultants: Provide clients with precise valuation insights on V.I.P. Industries Limited (VIPINDNS) efficiently.
- Business Owners: Gain insights into how major companies like V.I.P. Industries Limited (VIPINDNS) are valued to inform your own business strategy.
- Finance Students: Master valuation techniques through practical applications using data from V.I.P. Industries Limited (VIPINDNS).
Contents of the Template
- Comprehensive DCF Model: An editable template featuring extensive valuation calculations.
- Real-World Data: V.I.P. Industries Limited’s (VIPINDNS) historical and forecasted financials preloaded for thorough analysis.
- Customizable Parameters: Modify WACC, growth rates, and tax assumptions to explore various scenarios.
- Financial Statements: Complete annual and quarterly financial breakdowns for enhanced insights.
- Key Ratios: Integrated analysis for assessing profitability, efficiency, and leverage.
- Dashboard with Visual Outputs: Graphs and tables presenting clear, actionable results.
Disclaimer
All information, articles, and product details provided on this website are for general informational and educational purposes only. We do not claim any ownership over, nor do we intend to infringe upon, any trademarks, copyrights, logos, brand names, or other intellectual property mentioned or depicted on this site. Such intellectual property remains the property of its respective owners, and any references here are made solely for identification or informational purposes, without implying any affiliation, endorsement, or partnership.
We make no representations or warranties, express or implied, regarding the accuracy, completeness, or suitability of any content or products presented. Nothing on this website should be construed as legal, tax, investment, financial, medical, or other professional advice. In addition, no part of this site—including articles or product references—constitutes a solicitation, recommendation, endorsement, advertisement, or offer to buy or sell any securities, franchises, or other financial instruments, particularly in jurisdictions where such activity would be unlawful.
All content is of a general nature and may not address the specific circumstances of any individual or entity. It is not a substitute for professional advice or services. Any actions you take based on the information provided here are strictly at your own risk. You accept full responsibility for any decisions or outcomes arising from your use of this website and agree to release us from any liability in connection with your use of, or reliance upon, the content or products found herein.