
|
Valoración DCF de Volcon, Inc. (VLCN) |
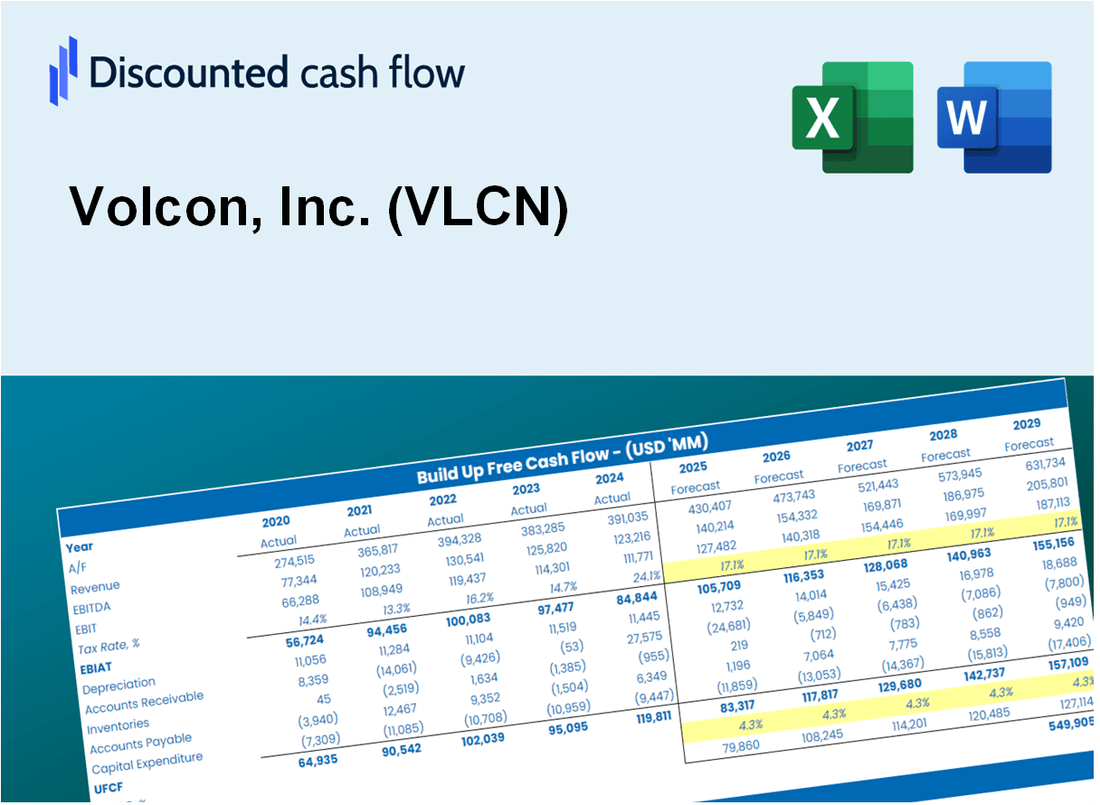
Completamente Editable: Adáptelo A Sus Necesidades En Excel O Sheets
Diseño Profesional: Plantillas Confiables Y Estándares De La Industria
Predeterminadas Para Un Uso Rápido Y Eficiente
Compatible con MAC / PC, completamente desbloqueado
No Se Necesita Experiencia; Fáciles De Seguir
Volcon, Inc. (VLCN) Bundle
¡Streamline Volcon, Inc. (VLCN) Valoración con nuestra calculadora DCF fácil de usar! Equipado con finanzas de Volcon precisas y entradas de pronóstico personalizables, puede explorar varios escenarios y determinar el valor razonable de Volcon en solo minutos.
What You Will Get
- Real VLCN Financials: Access to historical and projected data for precise valuation.
- Customizable Inputs: Adjust WACC, tax rates, revenue growth, and capital expenditures as needed.
- Dynamic Calculations: Intrinsic value and NPV are computed automatically.
- Scenario Analysis: Explore various scenarios to assess Volcon's future performance.
- User-Friendly Design: Designed for professionals while remaining accessible to newcomers.
Key Features
- Real-Life VLCN Data: Pre-filled with Volcon’s historical financials and future projections.
- Fully Customizable Inputs: Modify revenue growth rates, profit margins, WACC, tax rates, and capital expenditures.
- Dynamic Valuation Model: Automatic updates to Net Present Value (NPV) and intrinsic value based on your inputs.
- Scenario Testing: Develop multiple forecast scenarios to evaluate various valuation outcomes.
- User-Friendly Design: Intuitive, organized, and crafted for both professionals and newcomers.
How It Works
- Step 1: Download the Excel file.
- Step 2: Review Volcon, Inc.'s pre-filled financial data and forecasts.
- Step 3: Modify critical inputs like revenue growth, WACC, and tax rates (highlighted cells).
- Step 4: Watch the DCF model update instantly as you tweak assumptions.
- Step 5: Analyze the outputs and use the results for investment decisions regarding Volcon, Inc. (VLCN).
Why Choose This Calculator for Volcon, Inc. (VLCN)?
- Designed for Industry Experts: A sophisticated tool tailored for analysts, CFOs, and consultants in the electric vehicle sector.
- Accurate Financial Data: Volcon’s historical and projected financials preloaded for precise analysis.
- Flexible Scenario Analysis: Effortlessly test various forecasts and assumptions to gauge potential outcomes.
- Comprehensive Outputs: Automatically computes intrinsic value, NPV, and other critical financial metrics.
- User-Friendly Interface: Step-by-step guidance ensures a smooth experience throughout the calculation process.
Who Should Use Volcon, Inc. (VLCN)?
- Electric Vehicle Enthusiasts: Discover innovative technologies and understand market dynamics.
- Academics: Integrate advanced electric vehicle models into your research and studies.
- Investors: Evaluate your investment strategies and assess the growth potential of Volcon, Inc. (VLCN).
- Analysts: Optimize your analysis with a tailored financial model specific to the electric vehicle sector.
- Entrepreneurs: Learn from Volcon's approach to navigating the electric vehicle market and apply insights to your own ventures.
What the Template Contains
- Operating and Balance Sheet Data: Pre-filled Volcon, Inc. (VLCN) historical data and forecasts, including revenue, EBITDA, EBIT, and capital expenditures.
- WACC Calculation: A dedicated sheet for Weighted Average Cost of Capital (WACC), including parameters like Beta, risk-free rate, and share price.
- DCF Valuation (Unlevered and Levered): Editable Discounted Cash Flow models showing intrinsic value with detailed calculations.
- Financial Statements: Pre-loaded financial statements (annual and quarterly) to support analysis.
- Key Ratios: Includes profitability, leverage, and efficiency ratios for Volcon, Inc. (VLCN).
- Dashboard and Charts: Visual summary of valuation outputs and assumptions to analyze results easily.
Disclaimer
All information, articles, and product details provided on this website are for general informational and educational purposes only. We do not claim any ownership over, nor do we intend to infringe upon, any trademarks, copyrights, logos, brand names, or other intellectual property mentioned or depicted on this site. Such intellectual property remains the property of its respective owners, and any references here are made solely for identification or informational purposes, without implying any affiliation, endorsement, or partnership.
We make no representations or warranties, express or implied, regarding the accuracy, completeness, or suitability of any content or products presented. Nothing on this website should be construed as legal, tax, investment, financial, medical, or other professional advice. In addition, no part of this site—including articles or product references—constitutes a solicitation, recommendation, endorsement, advertisement, or offer to buy or sell any securities, franchises, or other financial instruments, particularly in jurisdictions where such activity would be unlawful.
All content is of a general nature and may not address the specific circumstances of any individual or entity. It is not a substitute for professional advice or services. Any actions you take based on the information provided here are strictly at your own risk. You accept full responsibility for any decisions or outcomes arising from your use of this website and agree to release us from any liability in connection with your use of, or reliance upon, the content or products found herein.