
|
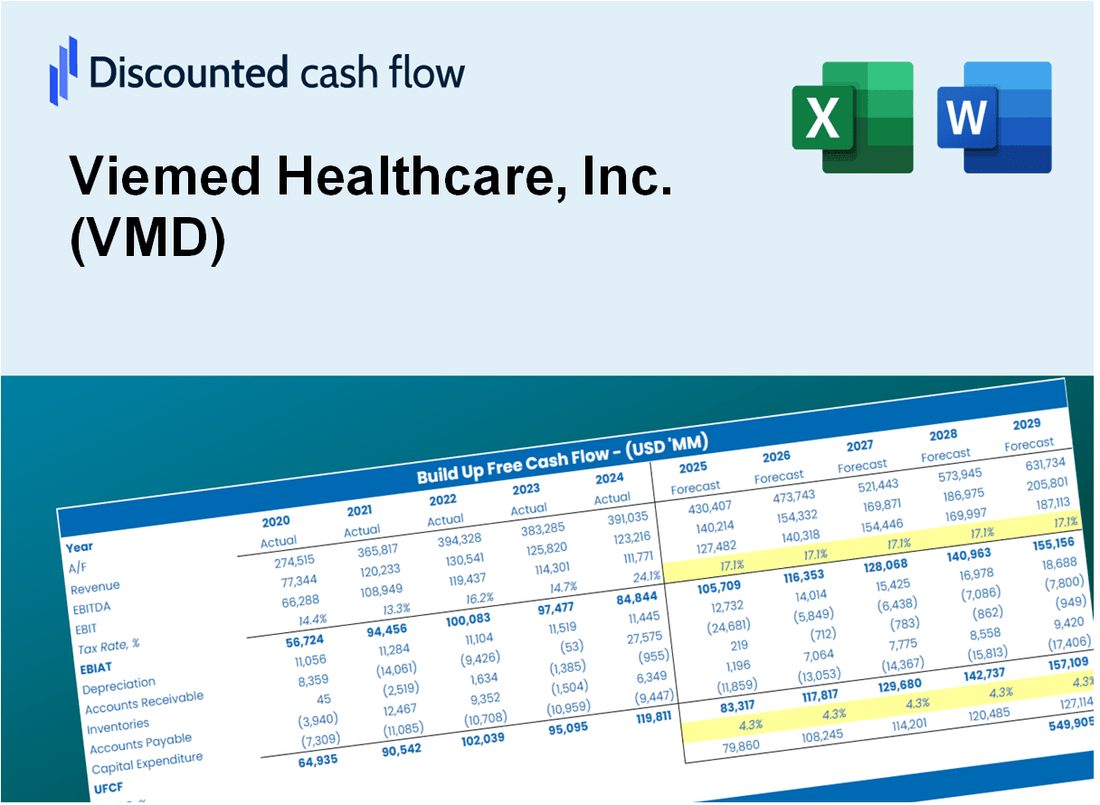
Valoración DCF de Viemed Healthcare, Inc. (VMD) |
Completamente Editable: Adáptelo A Sus Necesidades En Excel O Sheets
Diseño Profesional: Plantillas Confiables Y Estándares De La Industria
Predeterminadas Para Un Uso Rápido Y Eficiente
Compatible con MAC / PC, completamente desbloqueado
No Se Necesita Experiencia; Fáciles De Seguir
Viemed Healthcare, Inc. (VMD) Bundle
Como inversionista o analista, esta calculadora DCF para Viemed Healthcare, Inc. (VMD) es su recurso de referencia para una valoración precisa. Con datos reales de Viemed Healthcare ya integrados, puede ajustar los pronósticos y observar instantáneamente los efectos.
Discounted Cash Flow (DCF) - (USD MM)
| Year | AY1 2020 |
AY2 2021 |
AY3 2022 |
AY4 2023 |
AY5 2024 |
FY1 2025 |
FY2 2026 |
FY3 2027 |
FY4 2028 |
FY5 2029 |
|---|---|---|---|---|---|---|---|---|---|---|
| Revenue | 131.3 | 117.1 | 138.8 | 183.0 | 224.3 | 259.1 | 299.3 | 345.8 | 399.5 | 461.5 |
| Revenue Growth, % | 0 | -10.85 | 18.6 | 31.82 | 22.54 | 15.53 | 15.53 | 15.53 | 15.53 | 15.53 |
| EBITDA | 30.5 | 21.8 | 24.0 | 36.7 | 42.3 | 50.9 | 58.7 | 67.9 | 78.4 | 90.6 |
| EBITDA, % | 23.25 | 18.66 | 17.31 | 20.06 | 18.87 | 19.63 | 19.63 | 19.63 | 19.63 | 19.63 |
| Depreciation | 9.6 | 11.3 | 15.6 | 21.9 | 25.4 | 26.7 | 30.8 | 35.6 | 41.1 | 47.5 |
| Depreciation, % | 7.3 | 9.66 | 11.26 | 11.95 | 11.31 | 10.3 | 10.3 | 10.3 | 10.3 | 10.3 |
| EBIT | 21.0 | 10.5 | 8.4 | 14.8 | 16.9 | 24.2 | 27.9 | 32.3 | 37.3 | 43.1 |
| EBIT, % | 15.96 | 8.99 | 6.05 | 8.11 | 7.56 | 9.33 | 9.33 | 9.33 | 9.33 | 9.33 |
| Total Cash | 31.0 | 28.4 | 16.9 | 12.8 | 17.5 | 38.8 | 44.8 | 51.8 | 59.8 | 69.1 |
| Total Cash, percent | .0 | .0 | .0 | .0 | .0 | .0 | .0 | .0 | .0 | .0 |
| Account Receivables | 12.4 | 14.7 | 15.4 | 18.5 | 24.9 | 28.1 | 32.5 | 37.5 | 43.4 | 50.1 |
| Account Receivables, % | 9.42 | 12.57 | 11.1 | 10.08 | 11.11 | 10.86 | 10.86 | 10.86 | 10.86 | 10.86 |
| Inventories | 2.3 | 2.5 | 3.6 | 4.6 | 4.3 | 5.6 | 6.5 | 7.5 | 8.7 | 10.0 |
| Inventories, % | 1.76 | 2.1 | 2.57 | 2.53 | 1.93 | 2.18 | 2.18 | 2.18 | 2.18 | 2.18 |
| Accounts Payable | 2.1 | 3.2 | 2.7 | 7.4 | 9.3 | 7.5 | 8.7 | 10.0 | 11.6 | 13.4 |
| Accounts Payable, % | 1.6 | 2.77 | 1.91 | 4.05 | 4.16 | 2.9 | 2.9 | 2.9 | 2.9 | 2.9 |
| Capital Expenditure | -13.0 | -19.7 | -22.9 | -26.1 | -37.8 | -38.5 | -44.5 | -51.4 | -59.4 | -68.7 |
| Capital Expenditure, % | -9.93 | -16.87 | -16.49 | -14.26 | -16.84 | -14.88 | -14.88 | -14.88 | -14.88 | -14.88 |
| Tax Rate, % | 30.33 | 30.33 | 30.33 | 30.33 | 30.33 | 30.33 | 30.33 | 30.33 | 30.33 | 30.33 |
| EBITAT | 25.1 | 7.7 | 5.8 | 10.6 | 11.8 | 18.5 | 21.4 | 24.7 | 28.6 | 33.0 |
| Depreciation | ||||||||||
| Changes in Account Receivables | ||||||||||
| Changes in Inventories | ||||||||||
| Changes in Accounts Payable | ||||||||||
| Capital Expenditure | ||||||||||
| UFCF | 9.0 | -2.1 | -3.9 | 7.0 | -4.8 | .3 | 3.6 | 4.2 | 4.8 | 5.6 |
| WACC, % | 9.91 | 9.83 | 9.82 | 9.82 | 9.82 | 9.84 | 9.84 | 9.84 | 9.84 | 9.84 |
| PV UFCF | ||||||||||
| SUM PV UFCF | 13.2 | |||||||||
| Long Term Growth Rate, % | 2.00 | |||||||||
| Free cash flow (T + 1) | 6 | |||||||||
| Terminal Value | 72 | |||||||||
| Present Terminal Value | 45 | |||||||||
| Enterprise Value | 58 | |||||||||
| Net Debt | -11 | |||||||||
| Equity Value | 69 | |||||||||
| Diluted Shares Outstanding, MM | 41 | |||||||||
| Equity Value Per Share | 1.69 |
What You Will Get
- Comprehensive VMD Financials: Provides historical and projected data for precise valuation.
- Customizable Inputs: Adjust WACC, tax rates, revenue growth, and capital expenditures as needed.
- Dynamic Calculations: Intrinsic value and NPV are computed in real-time.
- Scenario Analysis: Evaluate various scenarios to assess Viemed’s future performance.
- User-Friendly Design: Designed for industry professionals while remaining accessible to newcomers.
Key Features
- Comprehensive Financial Data: Gain access to precise pre-loaded historical figures and future forecasts for Viemed Healthcare, Inc. (VMD).
- Adjustable Forecast Parameters: Modify highlighted cells for assumptions such as WACC, growth rates, and margins to suit your analysis.
- Real-Time Calculations: Automatic recalculations for DCF, Net Present Value (NPV), and cash flow assessments.
- User-Friendly Dashboard: Intuitive charts and summaries designed to help you visualize your valuation outcomes.
- Suitable for All Experience Levels: A straightforward, user-centric layout tailored for investors, CFOs, and consultants alike.
How It Works
- Step 1: Download the Excel file.
- Step 2: Review pre-entered Viemed Healthcare data (historical and projected).
- Step 3: Adjust key assumptions (yellow cells) based on your analysis.
- Step 4: View automatic recalculations for Viemed Healthcare’s intrinsic value.
- Step 5: Use the outputs for investment decisions or reporting.
Why Choose This Calculator for Viemed Healthcare, Inc. (VMD)?
- All-in-One Solution: Features DCF, WACC, and comprehensive financial ratio analyses tailored for healthcare.
- Flexible Inputs: Modify the highlighted cells to explore different financial scenarios specific to Viemed.
- In-Depth Analysis: Automatically computes Viemed’s intrinsic value and Net Present Value for informed decision-making.
- Integrated Data: Comes with historical and projected data for precise financial assessments.
- Expert-Level Tool: Perfect for financial analysts, investors, and consultants focused on the healthcare sector.
Who Should Use Viemed Healthcare, Inc. (VMD)?
- Healthcare Investors: Make informed investment choices with a comprehensive analysis of Viemed's market position.
- Financial Analysts: Streamline your workflow with ready-to-use financial models tailored for Viemed's performance.
- Consultants: Easily modify reports and presentations to showcase Viemed's growth potential to clients.
- Healthcare Enthusiasts: Enhance your knowledge of the industry by exploring Viemed's innovative healthcare solutions.
- Educators and Students: Utilize Viemed's case studies as a hands-on resource in healthcare finance courses.
What the Template Contains
- Comprehensive DCF Model: Editable template featuring detailed valuation calculations tailored for Viemed Healthcare, Inc. (VMD).
- Real-World Data: Viemed’s historical and projected financials preloaded for thorough analysis.
- Customizable Parameters: Modify WACC, growth rates, and tax assumptions to explore various scenarios.
- Financial Statements: Complete annual and quarterly breakdowns for enhanced insights into the company's performance.
- Key Ratios: Integrated analysis for profitability, efficiency, and leverage metrics.
- Dashboard with Visual Outputs: Visualizations including charts and tables for clear, actionable results.
Disclaimer
All information, articles, and product details provided on this website are for general informational and educational purposes only. We do not claim any ownership over, nor do we intend to infringe upon, any trademarks, copyrights, logos, brand names, or other intellectual property mentioned or depicted on this site. Such intellectual property remains the property of its respective owners, and any references here are made solely for identification or informational purposes, without implying any affiliation, endorsement, or partnership.
We make no representations or warranties, express or implied, regarding the accuracy, completeness, or suitability of any content or products presented. Nothing on this website should be construed as legal, tax, investment, financial, medical, or other professional advice. In addition, no part of this site—including articles or product references—constitutes a solicitation, recommendation, endorsement, advertisement, or offer to buy or sell any securities, franchises, or other financial instruments, particularly in jurisdictions where such activity would be unlawful.
All content is of a general nature and may not address the specific circumstances of any individual or entity. It is not a substitute for professional advice or services. Any actions you take based on the information provided here are strictly at your own risk. You accept full responsibility for any decisions or outcomes arising from your use of this website and agree to release us from any liability in connection with your use of, or reliance upon, the content or products found herein.