
|
Valoración DCF de Vince Holding Corp. (VNCE) |
Completamente Editable: Adáptelo A Sus Necesidades En Excel O Sheets
Diseño Profesional: Plantillas Confiables Y Estándares De La Industria
Predeterminadas Para Un Uso Rápido Y Eficiente
Compatible con MAC / PC, completamente desbloqueado
No Se Necesita Experiencia; Fáciles De Seguir
Vince Holding Corp. (VNCE) Bundle
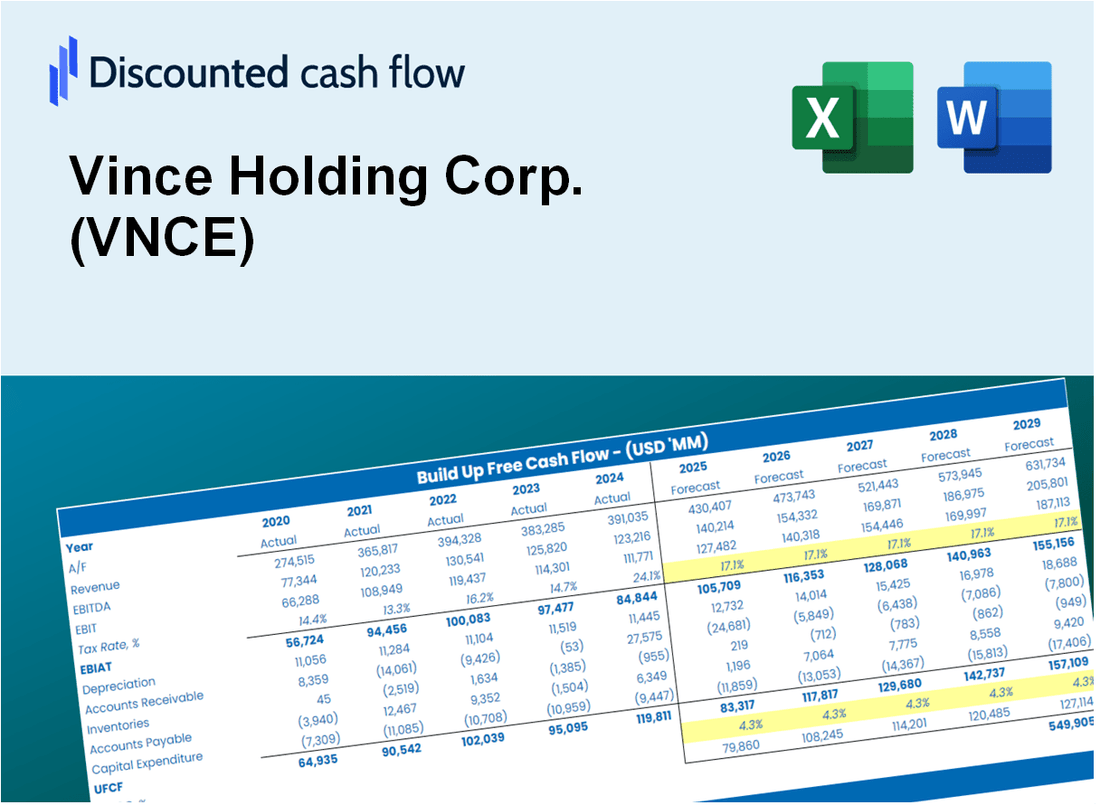
Ya sea que sea un inversor o analista, esta calculadora DCF (VNCE) es su recurso de referencia para una valoración precisa. Con datos reales de Vince Holding Corp., puede ajustar los pronósticos y observar los efectos en tiempo real.
Discounted Cash Flow (DCF) - (USD MM)
| Year | AY1 2020 |
AY2 2021 |
AY3 2022 |
AY4 2023 |
AY5 2024 |
FY1 2025 |
FY2 2026 |
FY3 2027 |
FY4 2028 |
FY5 2029 |
|---|---|---|---|---|---|---|---|---|---|---|
| Revenue | 219.9 | 322.7 | 357.4 | 292.9 | 293.5 | 322.6 | 354.5 | 389.7 | 428.3 | 470.8 |
| Revenue Growth, % | 0 | 46.76 | 10.77 | -18.06 | 0.19188 | 9.92 | 9.92 | 9.92 | 9.92 | 9.92 |
| EBITDA | -52.1 | 6.8 | -17.2 | 36.5 | -17.2 | -12.8 | -14.1 | -15.4 | -17.0 | -18.7 |
| EBITDA, % | -23.71 | 2.1 | -4.81 | 12.45 | -5.85 | -3.96 | -3.96 | -3.96 | -3.96 | -3.96 |
| Depreciation | 6.6 | 6.3 | 8.2 | 4.9 | -.3 | 5.7 | 6.3 | 6.9 | 7.6 | 8.3 |
| Depreciation, % | 3.02 | 1.95 | 2.31 | 1.69 | -0.11723 | 1.77 | 1.77 | 1.77 | 1.77 | 1.77 |
| EBIT | -58.8 | .5 | -25.4 | 31.5 | -16.8 | -18.5 | -20.3 | -22.3 | -24.6 | -27.0 |
| EBIT, % | -26.73 | 0.14968 | -7.11 | 10.76 | -5.74 | -5.73 | -5.73 | -5.73 | -5.73 | -5.73 |
| Total Cash | 3.8 | 1.1 | 1.1 | .4 | .6 | 1.7 | 1.9 | 2.1 | 2.3 | 2.5 |
| Total Cash, percent | .0 | .0 | .0 | .0 | .0 | .0 | .0 | .0 | .0 | .0 |
| Account Receivables | 31.9 | 29.9 | 20.7 | 20.7 | 32.9 | 30.9 | 33.9 | 37.3 | 41.0 | 45.1 |
| Account Receivables, % | 14.5 | 9.28 | 5.8 | 7.06 | 11.22 | 9.57 | 9.57 | 9.57 | 9.57 | 9.57 |
| Inventories | 68.2 | 78.6 | 90.0 | 58.8 | 59.1 | 77.9 | 85.6 | 94.1 | 103.5 | 113.7 |
| Inventories, % | 31.03 | 24.35 | 25.18 | 20.07 | 20.16 | 24.16 | 24.16 | 24.16 | 24.16 | 24.16 |
| Accounts Payable | 40.2 | 46.7 | 49.4 | 31.7 | 35.1 | 44.7 | 49.2 | 54.1 | 59.4 | 65.3 |
| Accounts Payable, % | 18.29 | 14.48 | 13.82 | 10.82 | 11.96 | 13.87 | 13.87 | 13.87 | 13.87 | 13.87 |
| Capital Expenditure | -3.5 | -5.1 | -2.8 | -1.5 | -4.2 | -3.8 | -4.2 | -4.6 | -5.0 | -5.5 |
| Capital Expenditure, % | -1.59 | -1.57 | -0.77831 | -0.49848 | -1.44 | -1.18 | -1.18 | -1.18 | -1.18 | -1.18 |
| Tax Rate, % | 16.05 | 16.05 | 16.05 | 16.05 | 16.05 | 16.05 | 16.05 | 16.05 | 16.05 | 16.05 |
| EBITAT | -58.9 | .8 | -27.6 | 39.1 | -14.1 | -17.9 | -19.7 | -21.6 | -23.8 | -26.1 |
| Depreciation | ||||||||||
| Changes in Account Receivables | ||||||||||
| Changes in Inventories | ||||||||||
| Changes in Accounts Payable | ||||||||||
| Capital Expenditure | ||||||||||
| UFCF | -115.7 | .1 | -21.7 | 56.2 | -27.9 | -23.0 | -23.9 | -26.3 | -28.9 | -31.8 |
| WACC, % | 5.73 | 5.73 | 5.73 | 5.73 | 5.04 | 5.59 | 5.59 | 5.59 | 5.59 | 5.59 |
| PV UFCF | ||||||||||
| SUM PV UFCF | -113.1 | |||||||||
| Long Term Growth Rate, % | 2.00 | |||||||||
| Free cash flow (T + 1) | -32 | |||||||||
| Terminal Value | -903 | |||||||||
| Present Terminal Value | -688 | |||||||||
| Enterprise Value | -801 | |||||||||
| Net Debt | 122 | |||||||||
| Equity Value | -923 | |||||||||
| Diluted Shares Outstanding, MM | 13 | |||||||||
| Equity Value Per Share | -73.37 |
What You Will Get
- Real Vince Data: Preloaded financials – from revenue to EBIT – based on actual and projected figures.
- Full Customization: Adjust all critical parameters (yellow cells) like WACC, growth %, and tax rates.
- Instant Valuation Updates: Automatic recalculations to analyze the impact of changes on Vince Holding Corp.'s fair value.
- Versatile Excel Template: Tailored for quick edits, scenario testing, and detailed projections.
- Time-Saving and Accurate: Skip building models from scratch while maintaining precision and flexibility.
Key Features
- Pre-Loaded Data: Vince Holding Corp.’s historical financial statements and pre-filled forecasts.
- Fully Adjustable Inputs: Edit WACC, tax rates, revenue growth, and EBITDA margins.
- Instant Results: See Vince Holding Corp.’s intrinsic value recalculate in real time.
- Clear Visual Outputs: Dashboard charts display valuation results and key metrics.
- Built for Accuracy: A professional tool for analysts, investors, and finance experts.
How It Works
- 1. Access the Template: Download and open the Excel file featuring Vince Holding Corp.'s (VNCE) preloaded data.
- 2. Modify Assumptions: Adjust essential inputs such as growth projections, WACC, and capital expenditures.
- 3. Analyze Results Immediately: The DCF model automatically computes intrinsic value and NPV in real-time.
- 4. Evaluate Scenarios: Explore various forecasts to assess different valuation results.
- 5. Present with Assurance: Share expert valuation insights to bolster your decision-making process.
Why Choose Vince Holding Corp. (VNCE)?
- Save Time: Streamlined processes mean you can focus on strategic decisions without the hassle.
- Enhance Accuracy: Dependable financial insights and metrics minimize valuation discrepancies.
- Fully Customizable: Adjust the framework to align with your unique business forecasts and goals.
- Easy to Understand: Intuitive visuals and outputs simplify data interpretation for informed analysis.
- Trusted by Professionals: Crafted for industry leaders who prioritize accuracy and functionality.
Who Should Use This Product?
- Fashion Students: Discover industry trends and apply them using real market data.
- Researchers: Integrate advanced models into your studies or publications on retail analysis.
- Investors: Evaluate your investment strategies and assess valuation outcomes for Vince Holding Corp. (VNCE).
- Market Analysts: Enhance your analysis process with a ready-to-use, customizable financial model.
- Entrepreneurs: Understand how major fashion brands like Vince Holding Corp. (VNCE) are valued in the marketplace.
What the Template Contains
- Pre-Filled DCF Model: Vince Holding Corp.’s (VNCE) financial data preloaded for immediate use.
- WACC Calculator: Detailed calculations for Weighted Average Cost of Capital.
- Financial Ratios: Evaluate Vince Holding Corp.’s (VNCE) profitability, leverage, and efficiency.
- Editable Inputs: Change assumptions such as growth, margins, and CAPEX to fit your scenarios.
- Financial Statements: Annual and quarterly reports to support detailed analysis.
- Interactive Dashboard: Easily visualize key valuation metrics and results.
Disclaimer
All information, articles, and product details provided on this website are for general informational and educational purposes only. We do not claim any ownership over, nor do we intend to infringe upon, any trademarks, copyrights, logos, brand names, or other intellectual property mentioned or depicted on this site. Such intellectual property remains the property of its respective owners, and any references here are made solely for identification or informational purposes, without implying any affiliation, endorsement, or partnership.
We make no representations or warranties, express or implied, regarding the accuracy, completeness, or suitability of any content or products presented. Nothing on this website should be construed as legal, tax, investment, financial, medical, or other professional advice. In addition, no part of this site—including articles or product references—constitutes a solicitation, recommendation, endorsement, advertisement, or offer to buy or sell any securities, franchises, or other financial instruments, particularly in jurisdictions where such activity would be unlawful.
All content is of a general nature and may not address the specific circumstances of any individual or entity. It is not a substitute for professional advice or services. Any actions you take based on the information provided here are strictly at your own risk. You accept full responsibility for any decisions or outcomes arising from your use of this website and agree to release us from any liability in connection with your use of, or reliance upon, the content or products found herein.