
|
Valoración DCF de VNET Group, Inc. (VNET) |
Completamente Editable: Adáptelo A Sus Necesidades En Excel O Sheets
Diseño Profesional: Plantillas Confiables Y Estándares De La Industria
Predeterminadas Para Un Uso Rápido Y Eficiente
Compatible con MAC / PC, completamente desbloqueado
No Se Necesita Experiencia; Fáciles De Seguir
VNET Group, Inc. (VNET) Bundle
¡Explore VNET Group, Inc. (VNET) perspectivas financieras con nuestra calculadora DCF fácil de usar! Ingrese sus suposiciones para el crecimiento, los márgenes y los gastos para calcular el valor intrínseco de VNET Group, Inc. (VNET) y mejorar su estrategia de inversión.
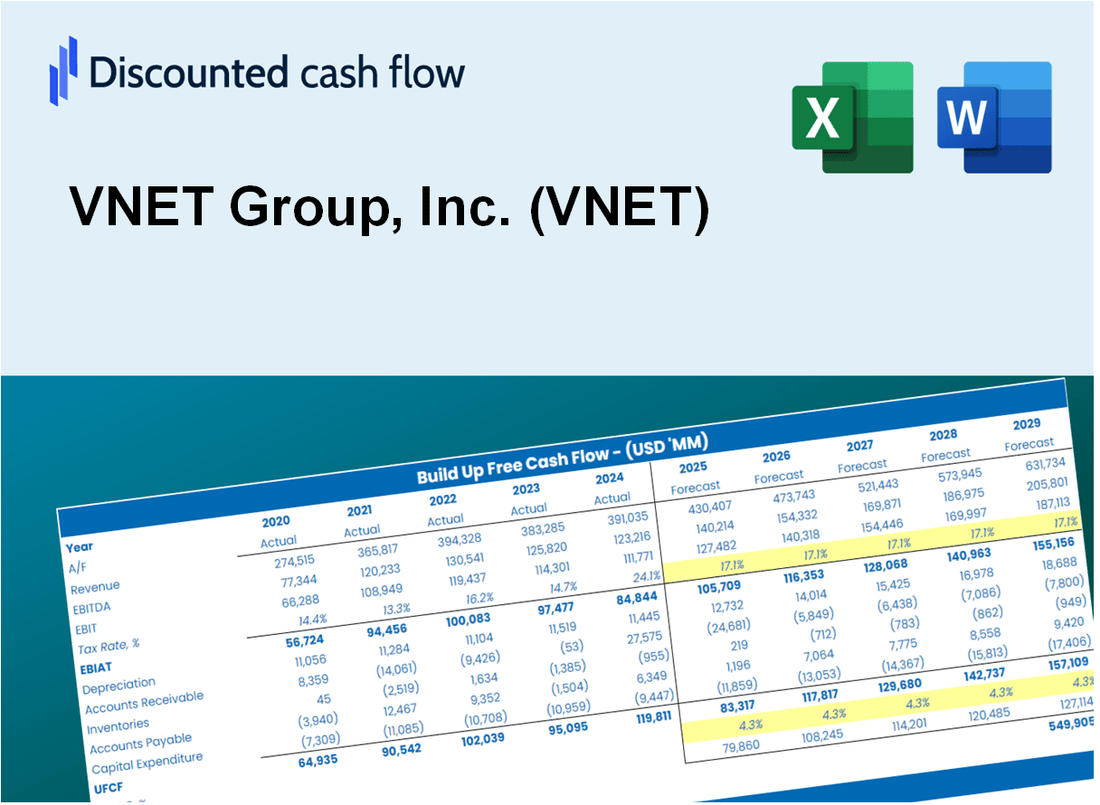
Discounted Cash Flow (DCF) - (USD MM)
| Year | AY1 2020 |
AY2 2021 |
AY3 2022 |
AY4 2023 |
AY5 2024 |
FY1 2025 |
FY2 2026 |
FY3 2027 |
FY4 2028 |
FY5 2029 |
|---|---|---|---|---|---|---|---|---|---|---|
| Revenue | 678.9 | 870.2 | 993.3 | 1,042.2 | 1,161.1 | 1,162.4 | 1,163.6 | 1,164.9 | 1,166.1 | 1,167.4 |
| Revenue Growth, % | 0 | 28.18 | 14.14 | 4.92 | 11.41 | 0.10809 | 0.10809 | 0.10809 | 0.10809 | 0.10809 |
| EBITDA | -170.4 | 318.8 | 174.2 | -51.5 | 311.5 | 118.4 | 118.6 | 118.7 | 118.8 | 119.0 |
| EBITDA, % | -25.1 | 36.64 | 17.53 | -4.94 | 26.82 | 10.19 | 10.19 | 10.19 | 10.19 | 10.19 |
| Depreciation | 139.0 | 178.2 | 224.4 | 254.1 | 217.3 | 247.9 | 248.2 | 248.5 | 248.7 | 249.0 |
| Depreciation, % | 20.48 | 20.48 | 22.59 | 24.38 | 18.72 | 21.33 | 21.33 | 21.33 | 21.33 | 21.33 |
| EBIT | -309.5 | 140.6 | -50.2 | -305.6 | 94.1 | -129.5 | -129.6 | -129.8 | -129.9 | -130.0 |
| EBIT, % | -45.58 | 16.16 | -5.06 | -29.33 | 8.11 | -11.14 | -11.14 | -11.14 | -11.14 | -11.14 |
| Total Cash | 421.2 | 14.1 | 1.1 | 365.6 | 217.4 | 273.3 | 273.6 | 273.9 | 274.2 | 274.5 |
| Total Cash, percent | .0 | .0 | .0 | .0 | .0 | .0 | .0 | .0 | .0 | .0 |
| Account Receivables | 119.3 | 200.3 | 248.2 | 241.3 | 471.7 | 300.7 | 301.0 | 301.4 | 301.7 | 302.0 |
| Account Receivables, % | 17.57 | 23.02 | 24.99 | 23.15 | 40.63 | 25.87 | 25.87 | 25.87 | 25.87 | 25.87 |
| Inventories | .0 | .0 | .0 | -.4 | .0 | -.1 | -.1 | -.1 | -.1 | -.1 |
| Inventories, % | 0 | 0 | 0 | -0.03396768 | 0 | -0.00679354 | -0.00679354 | -0.00679354 | -0.00679354 | -0.00679354 |
| Accounts Payable | 40.9 | 70.4 | 101.2 | 97.9 | 99.7 | 98.3 | 98.4 | 98.5 | 98.6 | 98.7 |
| Accounts Payable, % | 6.02 | 8.09 | 10.19 | 9.39 | 8.59 | 8.46 | 8.46 | 8.46 | 8.46 | 8.46 |
| Capital Expenditure | -351.9 | -384.4 | -429.2 | -430.3 | -721.0 | -564.0 | -564.6 | -565.2 | -565.8 | -566.4 |
| Capital Expenditure, % | -51.84 | -44.17 | -43.21 | -41.29 | -62.09 | -48.52 | -48.52 | -48.52 | -48.52 | -48.52 |
| Tax Rate, % | 62.04 | 62.04 | 62.04 | 62.04 | 62.04 | 62.04 | 62.04 | 62.04 | 62.04 | 62.04 |
| EBITAT | -322.6 | 105.7 | -60.8 | -325.4 | 35.7 | -107.0 | -107.1 | -107.2 | -107.3 | -107.5 |
| Depreciation | ||||||||||
| Changes in Account Receivables | ||||||||||
| Changes in Inventories | ||||||||||
| Changes in Accounts Payable | ||||||||||
| Capital Expenditure | ||||||||||
| UFCF | -613.9 | -152.0 | -282.8 | -497.8 | -696.8 | -253.4 | -423.7 | -424.2 | -424.7 | -425.1 |
| WACC, % | 3.88 | 3.11 | 3.88 | 3.88 | 1.96 | 3.34 | 3.34 | 3.34 | 3.34 | 3.34 |
| PV UFCF | ||||||||||
| SUM PV UFCF | -1,759.4 | |||||||||
| Long Term Growth Rate, % | 3.80 | |||||||||
| Free cash flow (T + 1) | -441 | |||||||||
| Terminal Value | 96,064 | |||||||||
| Present Terminal Value | 81,509 | |||||||||
| Enterprise Value | 79,749 | |||||||||
| Net Debt | 2,334 | |||||||||
| Equity Value | 77,415 | |||||||||
| Diluted Shares Outstanding, MM | 48 | |||||||||
| Equity Value Per Share | 1,599.54 |
What You Will Get
- Real VNET Financials: Access to historical and projected data for precise valuation.
- Customizable Inputs: Adjust WACC, tax rates, revenue growth, and capital expenditures as needed.
- Dynamic Calculations: Intrinsic value and NPV are computed in real-time.
- Scenario Analysis: Explore various scenarios to assess VNET's future performance.
- User-Friendly Design: Designed for professionals while remaining approachable for newcomers.
Key Features
- 🔍 Real-Life VNET Financials: Pre-filled historical and projected data for VNET Group, Inc. (VNET).
- ✏️ Fully Customizable Inputs: Adjust all critical parameters (yellow cells) like WACC, growth %, and tax rates.
- 📊 Professional DCF Valuation: Built-in formulas calculate VNET’s intrinsic value using the Discounted Cash Flow method.
- ⚡ Instant Results: Visualize VNET’s valuation instantly after making changes.
- Scenario Analysis: Test and compare outcomes for various financial assumptions side-by-side.
How It Works
- Download the Template: Gain immediate access to the Excel-based VNET DCF Calculator.
- Input Your Assumptions: Modify the yellow-highlighted cells for growth rates, WACC, margins, and other parameters.
- Instant Calculations: The model will automatically update VNET’s intrinsic value.
- Test Scenarios: Experiment with various assumptions to assess potential changes in valuation.
- Analyze and Decide: Utilize the results to inform your investment or financial analysis.
Why Choose This Calculator for VNET Group, Inc. (VNET)?
- Designed for Experts: A sophisticated tool utilized by financial analysts, CFOs, and industry consultants.
- Accurate Financials: VNET's historical and projected financial data preloaded for precision.
- Flexible Scenario Analysis: Effortlessly simulate various forecasts and assumptions.
- Insightful Outputs: Automatically computes intrinsic value, NPV, and essential metrics.
- User-Friendly: Step-by-step guidance helps you navigate the calculations with ease.
Who Should Use VNET Group, Inc. (VNET)?
- Investors: Gain insights and make informed decisions with a robust valuation tool tailored for VNET.
- Financial Analysts: Streamline your analysis with a customizable DCF model specifically designed for VNET.
- Consultants: Effortlessly modify the template for impactful client presentations or reports regarding VNET.
- Finance Enthusiasts: Enhance your knowledge of valuation methods through practical examples related to VNET.
- Educators and Students: Utilize it as a hands-on resource in finance courses focusing on VNET and its industry.
What the Template Contains
- Pre-Filled DCF Model: VNET Group, Inc.'s (VNET) financial data preloaded for immediate use.
- WACC Calculator: Detailed calculations for Weighted Average Cost of Capital.
- Financial Ratios: Evaluate VNET Group, Inc.'s (VNET) profitability, leverage, and efficiency.
- Editable Inputs: Change assumptions such as growth, margins, and CAPEX to fit your scenarios.
- Financial Statements: Annual and quarterly reports to support detailed analysis.
- Interactive Dashboard: Easily visualize key valuation metrics and results.
Disclaimer
All information, articles, and product details provided on this website are for general informational and educational purposes only. We do not claim any ownership over, nor do we intend to infringe upon, any trademarks, copyrights, logos, brand names, or other intellectual property mentioned or depicted on this site. Such intellectual property remains the property of its respective owners, and any references here are made solely for identification or informational purposes, without implying any affiliation, endorsement, or partnership.
We make no representations or warranties, express or implied, regarding the accuracy, completeness, or suitability of any content or products presented. Nothing on this website should be construed as legal, tax, investment, financial, medical, or other professional advice. In addition, no part of this site—including articles or product references—constitutes a solicitation, recommendation, endorsement, advertisement, or offer to buy or sell any securities, franchises, or other financial instruments, particularly in jurisdictions where such activity would be unlawful.
All content is of a general nature and may not address the specific circumstances of any individual or entity. It is not a substitute for professional advice or services. Any actions you take based on the information provided here are strictly at your own risk. You accept full responsibility for any decisions or outcomes arising from your use of this website and agree to release us from any liability in connection with your use of, or reliance upon, the content or products found herein.