
|
Valoración DCF de Vornado Realty Trust (VNO) |
Completamente Editable: Adáptelo A Sus Necesidades En Excel O Sheets
Diseño Profesional: Plantillas Confiables Y Estándares De La Industria
Predeterminadas Para Un Uso Rápido Y Eficiente
Compatible con MAC / PC, completamente desbloqueado
No Se Necesita Experiencia; Fáciles De Seguir
Vornado Realty Trust (VNO) Bundle
¡Evalúe las perspectivas financieras de Vornado Realty Trust (VNO) como un experto! Esta calculadora DCF (VNO) le proporciona datos financieros precipidos y la flexibilidad para modificar el crecimiento de los ingresos, WACC, los márgenes y otros supuestos esenciales para alinearse con sus proyecciones.
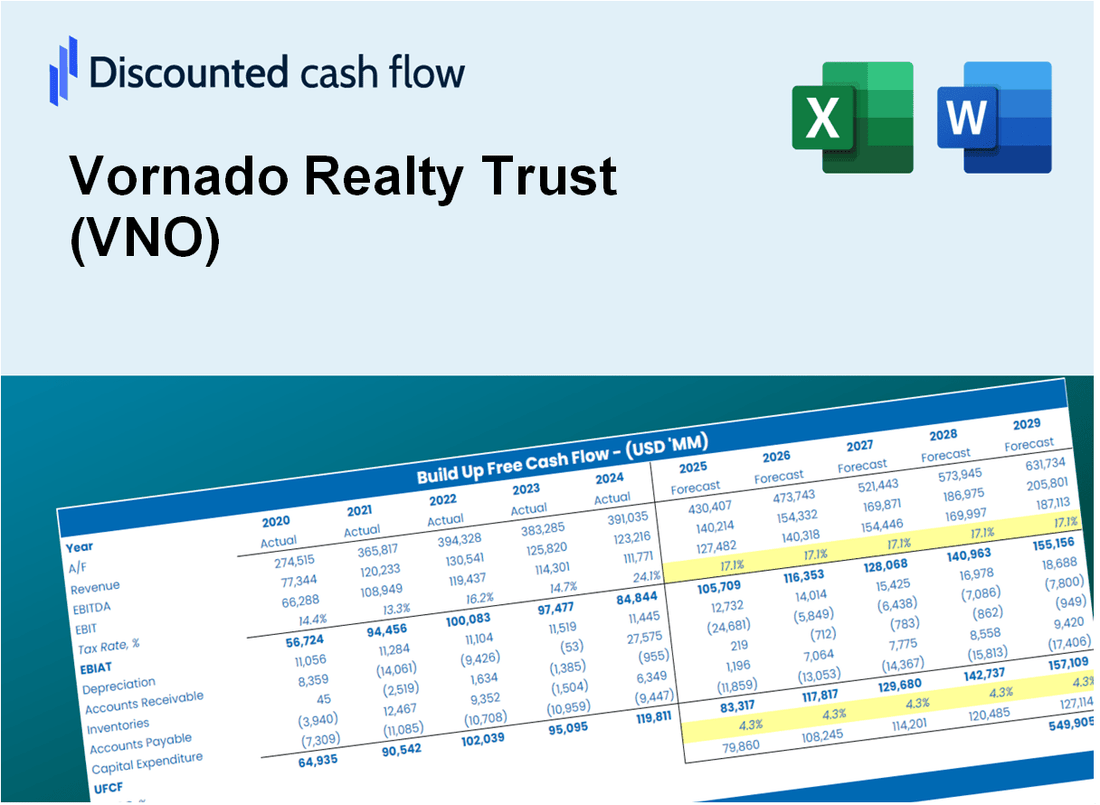
Discounted Cash Flow (DCF) - (USD MM)
| Year | AY1 2020 |
AY2 2021 |
AY3 2022 |
AY4 2023 |
AY5 2024 |
FY1 2025 |
FY2 2026 |
FY3 2027 |
FY4 2028 |
FY5 2029 |
|---|---|---|---|---|---|---|---|---|---|---|
| Revenue | 1,528.0 | 1,589.2 | 1,800.0 | 1,811.2 | 1,787.7 | 1,861.9 | 1,939.1 | 2,019.6 | 2,103.4 | 2,190.6 |
| Revenue Growth, % | 0 | 4.01 | 13.26 | 0.62045 | -1.3 | 4.15 | 4.15 | 4.15 | 4.15 | 4.15 |
| EBITDA | 203.5 | 840.5 | 423.3 | 845.6 | 880.6 | 691.4 | 720.1 | 750.0 | 781.1 | 813.5 |
| EBITDA, % | 13.32 | 52.89 | 23.52 | 46.69 | 49.26 | 37.13 | 37.13 | 37.13 | 37.13 | 37.13 |
| Depreciation | 417.9 | 432.6 | 526.3 | 457.6 | 469.4 | 504.0 | 524.9 | 546.6 | 569.3 | 592.9 |
| Depreciation, % | 27.35 | 27.22 | 29.24 | 25.26 | 26.26 | 27.07 | 27.07 | 27.07 | 27.07 | 27.07 |
| EBIT | -214.4 | 407.9 | -103.0 | 388.0 | 411.2 | 187.4 | 195.2 | 203.3 | 211.8 | 220.5 |
| EBIT, % | -14.03 | 25.67 | -5.72 | 21.42 | 23 | 10.07 | 10.07 | 10.07 | 10.07 | 10.07 |
| Total Cash | 1,624.5 | 1,760.2 | 1,361.7 | 997.0 | 733.9 | 1,384.3 | 1,441.7 | 1,501.6 | 1,563.9 | 1,628.7 |
| Total Cash, percent | .0 | .0 | .0 | .0 | .0 | .0 | .0 | .0 | .0 | .0 |
| Account Receivables | 751.7 | 736.0 | 776.1 | 771.2 | 765.9 | 834.3 | 868.9 | 905.0 | 942.5 | 981.6 |
| Account Receivables, % | 49.2 | 46.31 | 43.12 | 42.58 | 42.84 | 44.81 | 44.81 | 44.81 | 44.81 | 44.81 |
| Inventories | .0 | .0 | .0 | .0 | .0 | .0 | .0 | .0 | .0 | .0 |
| Inventories, % | 0 | 0 | 0 | 0 | 0 | 0 | 0 | 0 | 0 | 0 |
| Accounts Payable | 427.2 | 613.5 | .0 | .0 | 374.0 | 325.8 | 339.3 | 353.4 | 368.0 | 383.3 |
| Accounts Payable, % | 27.96 | 38.6 | 0 | 0 | 20.92 | 17.5 | 17.5 | 17.5 | 17.5 | 17.5 |
| Capital Expenditure | -395.1 | -3.0 | -3.0 | .0 | .0 | -97.6 | -101.6 | -105.9 | -110.3 | -114.8 |
| Capital Expenditure, % | -25.85 | -0.18877 | -0.16667 | 0 | 0 | -5.24 | -5.24 | -5.24 | -5.24 | -5.24 |
| Tax Rate, % | -64.28 | -64.28 | -64.28 | -64.28 | -64.28 | -64.28 | -64.28 | -64.28 | -64.28 | -64.28 |
| EBITAT | -149.8 | 364.3 | -98.9 | 659.1 | 675.5 | 170.6 | 177.7 | 185.1 | 192.8 | 200.8 |
| Depreciation | ||||||||||
| Changes in Account Receivables | ||||||||||
| Changes in Inventories | ||||||||||
| Changes in Accounts Payable | ||||||||||
| Capital Expenditure | ||||||||||
| UFCF | -451.4 | 996.0 | -229.2 | 1,121.6 | 1,524.3 | 460.3 | 579.8 | 603.9 | 628.9 | 655.0 |
| WACC, % | 6.23 | 6.69 | 6.85 | 6.94 | 6.94 | 6.73 | 6.73 | 6.73 | 6.73 | 6.73 |
| PV UFCF | ||||||||||
| SUM PV UFCF | 2,394.7 | |||||||||
| Long Term Growth Rate, % | 4.00 | |||||||||
| Free cash flow (T + 1) | 681 | |||||||||
| Terminal Value | 24,961 | |||||||||
| Present Terminal Value | 18,024 | |||||||||
| Enterprise Value | 20,418 | |||||||||
| Net Debt | 8,259 | |||||||||
| Equity Value | 12,160 | |||||||||
| Diluted Shares Outstanding, MM | 197 | |||||||||
| Equity Value Per Share | 61.84 |
What You Will Get
- Real Vornado Data: Preloaded financials – from revenue to EBIT – based on actual and projected figures.
- Full Customization: Adjust all critical parameters (yellow cells) like WACC, growth %, and tax rates.
- Instant Valuation Updates: Automatic recalculations to analyze the impact of changes on Vornado Realty Trust’s fair value.
- Versatile Excel Template: Tailored for quick edits, scenario testing, and detailed projections.
- Time-Saving and Accurate: Skip building models from scratch while maintaining precision and flexibility.
Key Features
- 🔍 Real-Life VNO Financials: Pre-filled historical and projected data for Vornado Realty Trust (VNO).
- ✏️ Fully Customizable Inputs: Adjust all critical parameters (yellow cells) such as WACC, growth %, and tax rates.
- 📊 Professional DCF Valuation: Built-in formulas calculate Vornado’s intrinsic value using the Discounted Cash Flow method.
- ⚡ Instant Results: Visualize Vornado’s valuation instantly after making changes.
- Scenario Analysis: Test and compare outcomes for various financial assumptions side-by-side.
How It Works
- Step 1: Download the Excel file.
- Step 2: Review Vornado Realty Trust’s pre-filled financial data and forecasts.
- Step 3: Modify key inputs such as rental income growth, capitalization rates, and operating expenses (highlighted cells).
- Step 4: Observe the DCF model update in real-time as you adjust your assumptions.
- Step 5: Analyze the results and utilize them for your investment strategies.
Why Choose Vornado Realty Trust (VNO)?
- Time-Efficient: Skip the hassle of building a real estate model from the ground up – it's ready for you.
- Enhanced Precision: Dependable market data and calculations minimize valuation discrepancies.
- Completely Customizable: Adjust the model to align with your investment assumptions and forecasts.
- User-Friendly: Intuitive visuals and outputs simplify the analysis of results.
- Endorsed by Professionals: Crafted for industry experts who prioritize accuracy and functionality.
Who Should Use This Product?
- Real Estate Investors: Develop comprehensive and accurate valuation models for property analysis.
- Corporate Finance Teams: Evaluate valuation scenarios to inform strategic decisions within the organization.
- Consultants and Advisors: Deliver precise valuation insights for Vornado Realty Trust (VNO) to clients.
- Students and Educators: Utilize real-world data to enhance learning and practice in financial modeling.
- Market Analysts: Gain insights into how real estate investment trusts like Vornado Realty Trust (VNO) are valued in the market.
What the Template Contains
- Operating and Balance Sheet Data: Pre-filled Vornado Realty Trust (VNO) historical data and forecasts, including revenue, EBITDA, EBIT, and capital expenditures.
- WACC Calculation: A dedicated sheet for Weighted Average Cost of Capital (WACC), including parameters like Beta, risk-free rate, and share price.
- DCF Valuation (Unlevered and Levered): Editable Discounted Cash Flow models showing intrinsic value with detailed calculations.
- Financial Statements: Pre-loaded financial statements (annual and quarterly) to support analysis.
- Key Ratios: Includes profitability, leverage, and efficiency ratios for Vornado Realty Trust (VNO).
- Dashboard and Charts: Visual summary of valuation outputs and assumptions to analyze results easily.
Disclaimer
All information, articles, and product details provided on this website are for general informational and educational purposes only. We do not claim any ownership over, nor do we intend to infringe upon, any trademarks, copyrights, logos, brand names, or other intellectual property mentioned or depicted on this site. Such intellectual property remains the property of its respective owners, and any references here are made solely for identification or informational purposes, without implying any affiliation, endorsement, or partnership.
We make no representations or warranties, express or implied, regarding the accuracy, completeness, or suitability of any content or products presented. Nothing on this website should be construed as legal, tax, investment, financial, medical, or other professional advice. In addition, no part of this site—including articles or product references—constitutes a solicitation, recommendation, endorsement, advertisement, or offer to buy or sell any securities, franchises, or other financial instruments, particularly in jurisdictions where such activity would be unlawful.
All content is of a general nature and may not address the specific circumstances of any individual or entity. It is not a substitute for professional advice or services. Any actions you take based on the information provided here are strictly at your own risk. You accept full responsibility for any decisions or outcomes arising from your use of this website and agree to release us from any liability in connection with your use of, or reliance upon, the content or products found herein.