
|
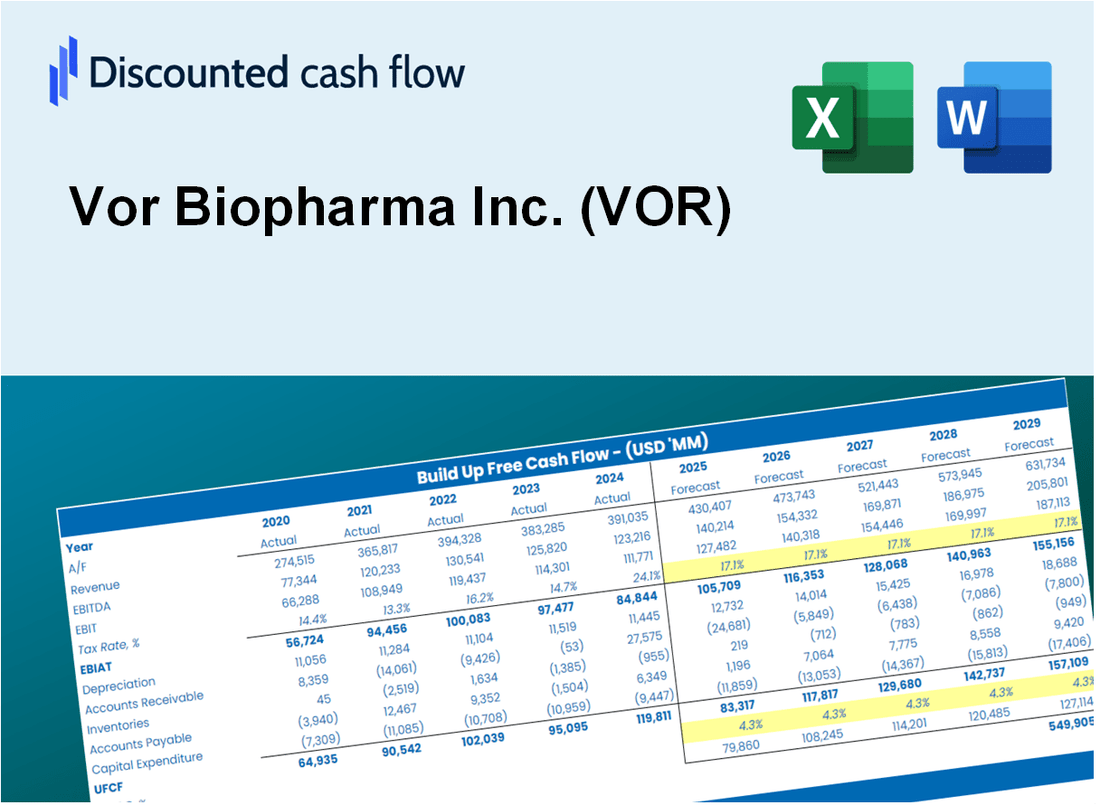
Valoración DCF de Vor Biopharma Inc. (VOR) |
Completamente Editable: Adáptelo A Sus Necesidades En Excel O Sheets
Diseño Profesional: Plantillas Confiables Y Estándares De La Industria
Predeterminadas Para Un Uso Rápido Y Eficiente
Compatible con MAC / PC, completamente desbloqueado
No Se Necesita Experiencia; Fáciles De Seguir
Vor Biopharma Inc. (VOR) Bundle
Ya sea que sea un inversor o analista, esta calculadora DCF [símbolo] es su recurso de referencia para una valoración precisa. Cargados con datos reales de VOR BioPharma Inc., puede ajustar los pronósticos e inmediatamente observar los efectos.
Discounted Cash Flow (DCF) - (USD MM)
| Year | AY1 2020 |
AY2 2021 |
AY3 2022 |
AY4 2023 |
AY5 2024 |
FY1 2025 |
FY2 2026 |
FY3 2027 |
FY4 2028 |
FY5 2029 |
|---|---|---|---|---|---|---|---|---|---|---|
| Revenue | .0 | .0 | .0 | .0 | .0 | .0 | .0 | .0 | .0 | .0 |
| Revenue Growth, % | 0 | 0 | 0 | 0 | 0 | 0 | 0 | 0 | 0 | 0 |
| EBITDA | -42.8 | -67.6 | -89.6 | -114.4 | -117.7 | .0 | .0 | .0 | .0 | .0 |
| EBITDA, % | 100 | 100 | 100 | 100 | 100 | 100 | 100 | 100 | 100 | 100 |
| Depreciation | .6 | 1.4 | 2.5 | 3.5 | 3.5 | .0 | .0 | .0 | .0 | .0 |
| Depreciation, % | 100 | 100 | 100 | 100 | 100 | 100 | 100 | 100 | 100 | 100 |
| EBIT | -43.4 | -69.0 | -92.1 | -117.9 | -121.2 | .0 | .0 | .0 | .0 | .0 |
| EBIT, % | 100 | 100 | 100 | 100 | 100 | 100 | 100 | 100 | 100 | 100 |
| Total Cash | 48.5 | 207.5 | 230.2 | 137.2 | 91.9 | .0 | .0 | .0 | .0 | .0 |
| Total Cash, percent | .0 | .0 | .0 | .0 | .0 | .0 | .0 | .0 | .0 | .0 |
| Account Receivables | .0 | .0 | .0 | .0 | .0 | .0 | .0 | .0 | .0 | .0 |
| Account Receivables, % | 100 | 100 | 100 | 100 | 100 | 100 | 100 | 100 | 100 | 100 |
| Inventories | .0 | .0 | .0 | .0 | .0 | .0 | .0 | .0 | .0 | .0 |
| Inventories, % | 100 | 100 | 100 | 100 | 100 | 100 | 100 | 100 | 100 | 100 |
| Accounts Payable | 2.4 | 1.5 | 1.8 | .8 | 1.5 | .0 | .0 | .0 | .0 | .0 |
| Accounts Payable, % | 100 | 100 | 100 | 100 | 100 | 100 | 100 | 100 | 100 | 100 |
| Capital Expenditure | -4.2 | -3.9 | -8.5 | -1.1 | -.2 | .0 | .0 | .0 | .0 | .0 |
| Capital Expenditure, % | 100 | 100 | 100 | 100 | 100 | 0 | 0 | 0 | 0 | 0 |
| Tax Rate, % | 0 | 0 | 0 | 0 | 0 | 0 | 0 | 0 | 0 | 0 |
| EBITAT | -43.4 | -69.0 | -90.8 | -117.9 | -121.2 | .0 | .0 | .0 | .0 | .0 |
| Depreciation | ||||||||||
| Changes in Account Receivables | ||||||||||
| Changes in Inventories | ||||||||||
| Changes in Accounts Payable | ||||||||||
| Capital Expenditure | ||||||||||
| UFCF | -44.6 | -72.3 | -96.5 | -116.4 | -117.2 | -1.5 | .0 | .0 | .0 | .0 |
| WACC, % | 8.69 | 8.69 | 8.67 | 8.69 | 8.69 | 8.69 | 8.69 | 8.69 | 8.69 | 8.69 |
| PV UFCF | ||||||||||
| SUM PV UFCF | -1.4 | |||||||||
| Long Term Growth Rate, % | 2.00 | |||||||||
| Free cash flow (T + 1) | 0 | |||||||||
| Terminal Value | 0 | |||||||||
| Present Terminal Value | 0 | |||||||||
| Enterprise Value | -1 | |||||||||
| Net Debt | -50 | |||||||||
| Equity Value | 49 | |||||||||
| Diluted Shares Outstanding, MM | 3 | |||||||||
| Equity Value Per Share | 14.19 |
What You Will Get
- Real VOR Financials: Access to historical and projected data for precise valuation.
- Customizable Inputs: Adjust WACC, tax rates, revenue growth, and capital expenditures as needed.
- Automatic Calculations: Intrinsic value and NPV are computed in real-time.
- Scenario Analysis: Evaluate various scenarios to assess Vor Biopharma's future performance.
- Clear and Intuitive Design: Designed for professionals while remaining user-friendly for newcomers.
Key Features
- Customizable Research Parameters: Adjust essential inputs such as clinical trial success rates, market penetration, and R&D expenditures.
- Instant Valuation Insights: Automatically computes intrinsic value, NPV, and other key metrics in real-time.
- Industry-Leading Precision: Leverages Vor Biopharma's (VOR) actual financial data for credible valuation results.
- Effortless Scenario Testing: Evaluate various assumptions and analyze results with ease.
- Efficiency Booster: Streamline your analysis without the hassle of constructing intricate valuation models from the ground up.
How It Works
- Step 1: Download the prebuilt Excel template featuring Vor Biopharma Inc.'s (VOR) data.
- Step 2: Review the pre-filled sheets to familiarize yourself with the essential metrics.
- Step 3: Adjust forecasts and assumptions in the editable yellow cells (WACC, growth, margins).
- Step 4: Instantly see recalculated results, including Vor Biopharma Inc.'s (VOR) intrinsic value.
- Step 5: Make well-informed investment decisions or create reports based on the outputs.
Why Choose Vor Biopharma's Calculator?
- Precision: Leveraging real Vor Biopharma financials for reliable data.
- Adaptability: Crafted for users to easily test and adjust inputs.
- Efficiency: Eliminate the need to create a DCF model from the ground up.
- Expert-Level: Designed with the accuracy and usability expected by CFOs.
- Intuitive: Simple to navigate, even for those without extensive financial modeling skills.
Who Should Use This Product?
- Biotech Students: Understand drug development processes and apply them using real-world examples.
- Researchers: Integrate advanced biopharmaceutical models into your studies or publications.
- Investors: Evaluate your investment strategies and assess the potential of Vor Biopharma Inc. (VOR).
- Market Analysts: Optimize your analysis with a tailored, ready-to-use financial model for biopharma.
- Healthcare Entrepreneurs: Discover how public biotech companies like Vor Biopharma Inc. (VOR) are evaluated in the market.
What the Template Contains
- Operating and Balance Sheet Data: Pre-filled Vor Biopharma Inc. (VOR) historical data and forecasts, including revenue, EBITDA, EBIT, and capital expenditures.
- WACC Calculation: A dedicated sheet for Weighted Average Cost of Capital (WACC), including parameters like Beta, risk-free rate, and share price.
- DCF Valuation (Unlevered and Levered): Editable Discounted Cash Flow models showing intrinsic value with detailed calculations.
- Financial Statements: Pre-loaded financial statements (annual and quarterly) to support analysis.
- Key Ratios: Includes profitability, leverage, and efficiency ratios for Vor Biopharma Inc. (VOR).
- Dashboard and Charts: Visual summary of valuation outputs and assumptions to analyze results easily.
Disclaimer
All information, articles, and product details provided on this website are for general informational and educational purposes only. We do not claim any ownership over, nor do we intend to infringe upon, any trademarks, copyrights, logos, brand names, or other intellectual property mentioned or depicted on this site. Such intellectual property remains the property of its respective owners, and any references here are made solely for identification or informational purposes, without implying any affiliation, endorsement, or partnership.
We make no representations or warranties, express or implied, regarding the accuracy, completeness, or suitability of any content or products presented. Nothing on this website should be construed as legal, tax, investment, financial, medical, or other professional advice. In addition, no part of this site—including articles or product references—constitutes a solicitation, recommendation, endorsement, advertisement, or offer to buy or sell any securities, franchises, or other financial instruments, particularly in jurisdictions where such activity would be unlawful.
All content is of a general nature and may not address the specific circumstances of any individual or entity. It is not a substitute for professional advice or services. Any actions you take based on the information provided here are strictly at your own risk. You accept full responsibility for any decisions or outcomes arising from your use of this website and agree to release us from any liability in connection with your use of, or reliance upon, the content or products found herein.