
|
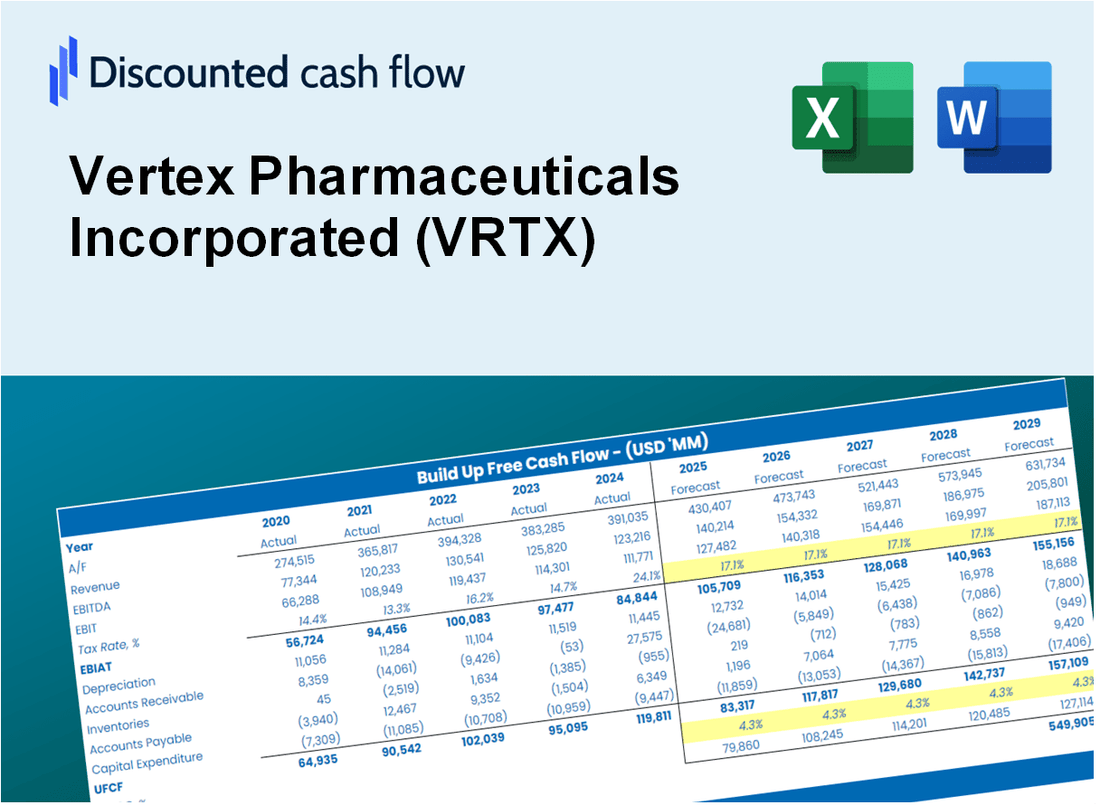
Valoración DCF de Vertex Pharmaceuticals Incorporated (VRTX) |
Completamente Editable: Adáptelo A Sus Necesidades En Excel O Sheets
Diseño Profesional: Plantillas Confiables Y Estándares De La Industria
Predeterminadas Para Un Uso Rápido Y Eficiente
Compatible con MAC / PC, completamente desbloqueado
No Se Necesita Experiencia; Fáciles De Seguir
Vertex Pharmaceuticals Incorporated (VRTX) Bundle
Diseñada para la precisión, nuestra calculadora DCF (VRTX) le permite evaluar la valoración de Vertex Pharmaceuticals Incorporated utilizando datos financieros del mundo real, con una flexibilidad completa para modificar todos los parámetros esenciales para mejorar las proyecciones.
Discounted Cash Flow (DCF) - (USD MM)
| Year | AY1 2020 |
AY2 2021 |
AY3 2022 |
AY4 2023 |
AY5 2024 |
FY1 2025 |
FY2 2026 |
FY3 2027 |
FY4 2028 |
FY5 2029 |
|---|---|---|---|---|---|---|---|---|---|---|
| Revenue | 6,205.7 | 7,574.4 | 8,930.7 | 9,869.2 | 11,020.1 | 12,001.8 | 13,070.8 | 14,235.2 | 15,503.2 | 16,884.2 |
| Revenue Growth, % | 0 | 22.06 | 17.91 | 10.51 | 11.66 | 8.91 | 8.91 | 8.91 | 8.91 | 8.91 |
| EBITDA | 3,284.5 | 2,917.5 | 4,435.5 | 4,605.2 | 486.3 | 4,613.1 | 5,024.1 | 5,471.6 | 5,959.0 | 6,489.8 |
| EBITDA, % | 52.93 | 38.52 | 49.67 | 46.66 | 4.41 | 38.44 | 38.44 | 38.44 | 38.44 | 38.44 |
| Depreciation | 109.5 | 125.6 | 148.3 | 181.3 | 205.8 | 210.9 | 229.7 | 250.2 | 272.5 | 296.8 |
| Depreciation, % | 1.76 | 1.66 | 1.66 | 1.84 | 1.87 | 1.76 | 1.76 | 1.76 | 1.76 | 1.76 |
| EBIT | 3,174.9 | 2,791.9 | 4,287.2 | 4,423.9 | 280.5 | 4,402.2 | 4,794.3 | 5,221.4 | 5,686.5 | 6,193.0 |
| EBIT, % | 51.16 | 36.86 | 48.01 | 44.83 | 2.55 | 36.68 | 36.68 | 36.68 | 36.68 | 36.68 |
| Total Cash | 6,658.9 | 7,524.9 | 10,778.5 | 11,218.3 | 6,115.9 | 10,917.9 | 11,890.4 | 12,949.6 | 14,103.1 | 15,359.4 |
| Total Cash, percent | .0 | .0 | .0 | .0 | .0 | .0 | .0 | .0 | .0 | .0 |
| Account Receivables | 885.4 | 1,136.8 | 1,442.2 | 1,563.4 | 1,609.4 | 1,821.2 | 1,983.4 | 2,160.1 | 2,352.5 | 2,562.0 |
| Account Receivables, % | 14.27 | 15.01 | 16.15 | 15.84 | 14.6 | 15.17 | 15.17 | 15.17 | 15.17 | 15.17 |
| Inventories | 280.8 | 353.1 | 460.6 | 738.8 | 1,205.4 | 786.5 | 856.6 | 932.9 | 1,016.0 | 1,106.5 |
| Inventories, % | 4.52 | 4.66 | 5.16 | 7.49 | 10.94 | 6.55 | 6.55 | 6.55 | 6.55 | 6.55 |
| Accounts Payable | 155.1 | 195.0 | 303.9 | 364.9 | 413.0 | 382.2 | 416.2 | 453.3 | 493.7 | 537.7 |
| Accounts Payable, % | 2.5 | 2.57 | 3.4 | 3.7 | 3.75 | 3.18 | 3.18 | 3.18 | 3.18 | 3.18 |
| Capital Expenditure | -259.8 | -235.0 | -204.7 | -258.4 | -297.7 | -357.7 | -389.5 | -424.2 | -462.0 | -503.2 |
| Capital Expenditure, % | -4.19 | -3.1 | -2.29 | -2.62 | -2.7 | -2.98 | -2.98 | -2.98 | -2.98 | -2.98 |
| Tax Rate, % | 315.53 | 315.53 | 315.53 | 315.53 | 315.53 | 315.53 | 315.53 | 315.53 | 315.53 | 315.53 |
| EBITAT | 2,762.2 | 2,394.9 | 3,365.0 | 3,656.0 | -604.6 | 2,939.9 | 3,201.8 | 3,487.0 | 3,797.6 | 4,135.9 |
| Depreciation | ||||||||||
| Changes in Account Receivables | ||||||||||
| Changes in Inventories | ||||||||||
| Changes in Accounts Payable | ||||||||||
| Capital Expenditure | ||||||||||
| UFCF | 1,600.8 | 2,001.6 | 3,004.6 | 3,240.5 | -1,161.0 | 2,969.4 | 2,843.7 | 3,097.0 | 3,372.9 | 3,673.4 |
| WACC, % | 5.23 | 5.23 | 5.22 | 5.23 | 5.18 | 5.22 | 5.22 | 5.22 | 5.22 | 5.22 |
| PV UFCF | ||||||||||
| SUM PV UFCF | 13,650.2 | |||||||||
| Long Term Growth Rate, % | 3.00 | |||||||||
| Free cash flow (T + 1) | 3,784 | |||||||||
| Terminal Value | 170,613 | |||||||||
| Present Terminal Value | 132,303 | |||||||||
| Enterprise Value | 145,953 | |||||||||
| Net Debt | -2,820 | |||||||||
| Equity Value | 148,773 | |||||||||
| Diluted Shares Outstanding, MM | 258 | |||||||||
| Equity Value Per Share | 576.86 |
What You Will Get
- Editable Forecast Inputs: Easily adjust assumptions (growth %, margins, WACC) to explore various scenarios.
- Real-World Data: Vertex Pharmaceuticals’ (VRTX) financial data pre-filled to kickstart your analysis.
- Automatic DCF Outputs: The template computes Net Present Value (NPV) and intrinsic value automatically.
- Customizable and Professional: A refined Excel model that tailors to your valuation requirements.
- Built for Analysts and Investors: Perfect for evaluating projections, confirming strategies, and saving time.
Key Features
- Real-Life VRTX Data: Pre-filled with Vertex Pharmaceuticals' historical financials and forward-looking projections.
- Fully Customizable Inputs: Adjust revenue growth, profit margins, WACC, tax rates, and capital expenditures.
- Dynamic Valuation Model: Automatic updates to Net Present Value (NPV) and intrinsic value based on your inputs.
- Scenario Testing: Create multiple forecast scenarios to analyze different valuation outcomes.
- User-Friendly Design: Simple, structured, and designed for professionals and beginners alike.
How It Works
- 1. Access the Template: Download and open the Excel file featuring Vertex Pharmaceuticals Incorporated’s (VRTX) preloaded data.
- 2. Modify Assumptions: Adjust critical inputs such as growth rates, WACC, and capital expenditures.
- 3. View Results Immediately: The DCF model automatically computes intrinsic value and NPV.
- 4. Explore Scenarios: Evaluate various forecasts to assess different valuation results.
- 5. Present with Assurance: Deliver professional valuation insights to back your strategic decisions.
Why Choose Vertex Pharmaceuticals (VRTX)?
- Innovative Solutions: Cutting-edge therapies designed to address unmet medical needs.
- Proven Track Record: A history of successful drug development and market introduction.
- Commitment to Research: Significant investment in R&D to drive future breakthroughs.
- Patient-Centric Approach: Focused on improving patient outcomes and quality of life.
- Recognized Leadership: Esteemed by industry experts for excellence and reliability.
Who Should Use Vertex Pharmaceuticals Incorporated (VRTX)?
- Investors: Make informed investment choices with insights into the biotech sector.
- Healthcare Analysts: Leverage comprehensive data for in-depth analysis of pharmaceutical trends.
- Consultants: Tailor research findings for client discussions or strategic recommendations.
- Biotech Enthusiasts: Expand your knowledge of drug development and market dynamics with real case studies.
- Educators and Students: Utilize it as a resource for understanding the intricacies of the pharmaceutical industry.
What the Template Contains
- Operating and Balance Sheet Data: Pre-filled Vertex Pharmaceuticals historical data and forecasts, including revenue, EBITDA, EBIT, and capital expenditures.
- WACC Calculation: A dedicated sheet for Weighted Average Cost of Capital (WACC), including parameters like Beta, risk-free rate, and share price.
- DCF Valuation (Unlevered and Levered): Editable Discounted Cash Flow models showing intrinsic value with detailed calculations.
- Financial Statements: Pre-loaded financial statements (annual and quarterly) to support analysis.
- Key Ratios: Includes profitability, leverage, and efficiency ratios for Vertex Pharmaceuticals (VRTX).
- Dashboard and Charts: Visual summary of valuation outputs and assumptions to analyze results easily.
Disclaimer
All information, articles, and product details provided on this website are for general informational and educational purposes only. We do not claim any ownership over, nor do we intend to infringe upon, any trademarks, copyrights, logos, brand names, or other intellectual property mentioned or depicted on this site. Such intellectual property remains the property of its respective owners, and any references here are made solely for identification or informational purposes, without implying any affiliation, endorsement, or partnership.
We make no representations or warranties, express or implied, regarding the accuracy, completeness, or suitability of any content or products presented. Nothing on this website should be construed as legal, tax, investment, financial, medical, or other professional advice. In addition, no part of this site—including articles or product references—constitutes a solicitation, recommendation, endorsement, advertisement, or offer to buy or sell any securities, franchises, or other financial instruments, particularly in jurisdictions where such activity would be unlawful.
All content is of a general nature and may not address the specific circumstances of any individual or entity. It is not a substitute for professional advice or services. Any actions you take based on the information provided here are strictly at your own risk. You accept full responsibility for any decisions or outcomes arising from your use of this website and agree to release us from any liability in connection with your use of, or reliance upon, the content or products found herein.