
|
VusionGroup (VU.PA) DCF Valoración |
Completamente Editable: Adáptelo A Sus Necesidades En Excel O Sheets
Diseño Profesional: Plantillas Confiables Y Estándares De La Industria
Predeterminadas Para Un Uso Rápido Y Eficiente
Compatible con MAC / PC, completamente desbloqueado
No Se Necesita Experiencia; Fáciles De Seguir
VusionGroup (VU.PA) Bundle
¡Descubra el verdadero valor de VusionGroup con nuestra calculadora DCF de grado profesional! Ajuste los supuestos clave, explore varios escenarios y evalúe cómo los cambios afectan la valoración de VusionGroup, todo dentro de una sola plantilla de Excel.
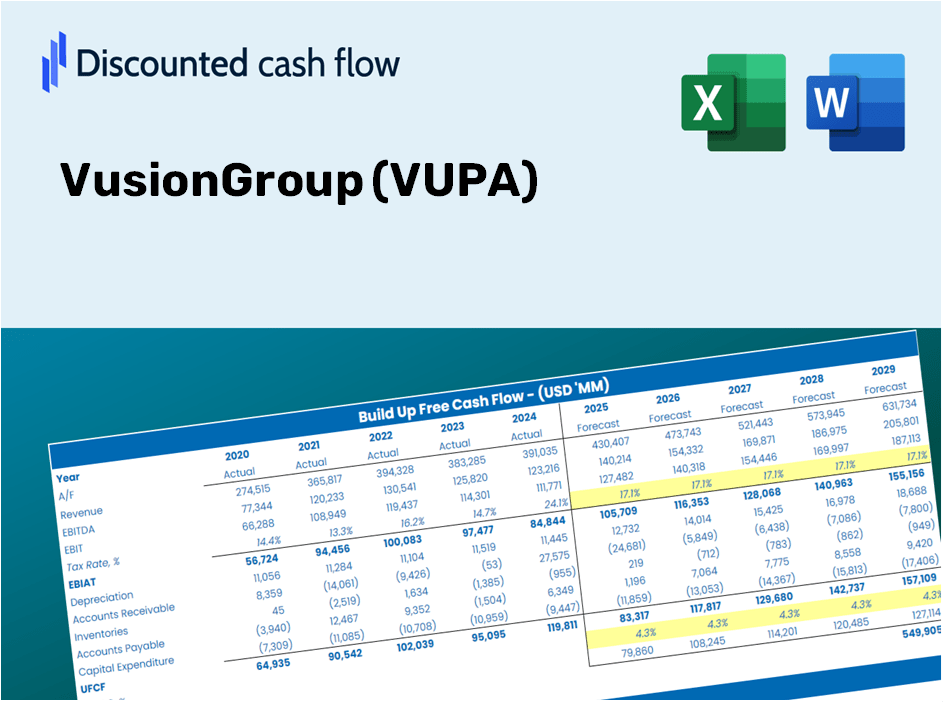
Discounted Cash Flow (DCF) - (USD MM)
| Year | AY1 2020 |
AY2 2021 |
AY3 2022 |
AY4 2023 |
AY5 2024 |
FY1 2025 |
FY2 2026 |
FY3 2027 |
FY4 2028 |
FY5 2029 |
|---|---|---|---|---|---|---|---|---|---|---|
| Revenue | 290.3 | 422.9 | 620.9 | 802.0 | 954.7 | 1,290.6 | 1,744.6 | 2,358.4 | 3,188.0 | 4,309.6 |
| Revenue Growth, % | 0 | 45.68 | 46.82 | 29.17 | 19.05 | 35.18 | 35.18 | 35.18 | 35.18 | 35.18 |
| EBITDA | 15.3 | 34.8 | 56.3 | 154.5 | 52.6 | 122.2 | 165.2 | 223.3 | 301.9 | 408.1 |
| EBITDA, % | 5.27 | 8.23 | 9.07 | 19.26 | 5.51 | 9.47 | 9.47 | 9.47 | 9.47 | 9.47 |
| Depreciation | 19.8 | 28.3 | 28.0 | 47.2 | 67.3 | 79.9 | 108.0 | 146.1 | 197.4 | 266.9 |
| Depreciation, % | 6.81 | 6.7 | 4.51 | 5.89 | 7.05 | 6.19 | 6.19 | 6.19 | 6.19 | 6.19 |
| EBIT | -4.5 | 6.5 | 28.3 | 107.2 | -14.7 | 42.3 | 57.2 | 77.3 | 104.4 | 141.2 |
| EBIT, % | -1.54 | 1.53 | 4.56 | 13.37 | -1.54 | 3.28 | 3.28 | 3.28 | 3.28 | 3.28 |
| Total Cash | 88.6 | 93.0 | 34.4 | 199.9 | 535.6 | 359.0 | 485.3 | 656.1 | 886.9 | 1,198.9 |
| Total Cash, percent | .0 | .0 | .0 | .0 | .0 | .0 | .0 | .0 | .0 | .0 |
| Account Receivables | 93.9 | 120.2 | 111.0 | 322.3 | 472.1 | 434.4 | 587.2 | 793.8 | 1,073.1 | 1,450.6 |
| Account Receivables, % | 32.35 | 28.43 | 17.87 | 40.2 | 49.45 | 33.66 | 33.66 | 33.66 | 33.66 | 33.66 |
| Inventories | 106.0 | 137.5 | 164.4 | 125.0 | 147.4 | 326.6 | 441.6 | 596.9 | 806.9 | 1,090.7 |
| Inventories, % | 36.52 | 32.52 | 26.48 | 15.59 | 15.44 | 25.31 | 25.31 | 25.31 | 25.31 | 25.31 |
| Accounts Payable | 48.9 | 81.9 | 109.4 | 103.2 | 151.3 | 213.1 | 288.1 | 389.4 | 526.4 | 711.6 |
| Accounts Payable, % | 16.84 | 19.38 | 17.63 | 12.86 | 15.85 | 16.51 | 16.51 | 16.51 | 16.51 | 16.51 |
| Capital Expenditure | -32.5 | -34.8 | -51.0 | -87.5 | -158.0 | -142.2 | -192.2 | -259.9 | -351.3 | -474.9 |
| Capital Expenditure, % | -11.19 | -8.24 | -8.21 | -10.91 | -16.55 | -11.02 | -11.02 | -11.02 | -11.02 | -11.02 |
| Tax Rate, % | -3.94 | -3.94 | -3.94 | -3.94 | -3.94 | -3.94 | -3.94 | -3.94 | -3.94 | -3.94 |
| EBITAT | -3.5 | 4.5 | 20.9 | 90.6 | -15.3 | 34.3 | 46.4 | 62.7 | 84.7 | 114.5 |
| Depreciation | ||||||||||
| Changes in Account Receivables | ||||||||||
| Changes in Inventories | ||||||||||
| Changes in Accounts Payable | ||||||||||
| Capital Expenditure | ||||||||||
| UFCF | -167.2 | -26.8 | 7.8 | -127.9 | -230.0 | -107.7 | -230.6 | -311.7 | -421.4 | -569.7 |
| WACC, % | 8.13 | 8.04 | 8.09 | 8.19 | 8.35 | 8.16 | 8.16 | 8.16 | 8.16 | 8.16 |
| PV UFCF | ||||||||||
| SUM PV UFCF | -1,235.8 | |||||||||
| Long Term Growth Rate, % | 2.00 | |||||||||
| Free cash flow (T + 1) | -581 | |||||||||
| Terminal Value | -9,433 | |||||||||
| Present Terminal Value | -6,373 | |||||||||
| Enterprise Value | -7,609 | |||||||||
| Net Debt | -383 | |||||||||
| Equity Value | -7,226 | |||||||||
| Diluted Shares Outstanding, MM | 16 | |||||||||
| Equity Value Per Share | -451.44 |
Benefits of Choosing VusionGroup
- Customizable Excel Template: A comprehensive Excel-based DCF Calculator featuring pre-populated financial data for VusionGroup (VUPA).
- Up-to-Date Financials: Access to historical figures and forward-looking projections (highlighted in the yellow cells).
- Adaptable Forecasting: Modify key assumptions such as revenue growth, EBITDA margin, and WACC as per your analysis.
- Instant Calculations: Quickly observe how your assumptions affect VusionGroup's (VUPA) valuation.
- Professional-Grade Resource: Designed for investors, CFOs, consultants, and financial analysts alike.
- Intuitive Layout: Organized for simplicity and ease of navigation, complete with detailed step-by-step guidance.
Key Features
- Real-Time VusionGroup (VUPA) Data: Pre-populated with VusionGroup’s historical performance and future forecasts.
- Completely Customizable Parameters: Modify growth rates, profit margins, discount rates, tax percentages, and capital investments.
- Interactive Valuation Framework: Automatic recalculations of Net Present Value (NPV) and intrinsic value based on your adjustments.
- Scenario Analysis: Develop various forecasting scenarios to explore different valuation possibilities.
- Intuitive User Interface: Clean, organized layout tailored for both experienced users and newcomers.
How It Works
- Step 1: Download the Excel file.
- Step 2: Review VusionGroup's (VUPA) pre-filled financial data and projections.
- Step 3: Adjust key parameters such as revenue growth, WACC, and tax rates (highlighted cells).
- Step 4: Observe the DCF model update in real-time as you revise your assumptions.
- Step 5: Evaluate the results and utilize them for your investment strategies.
Why Choose This Calculator for VusionGroup (VUPA)?
- Reliable Data: Access up-to-date VusionGroup financials for trustworthy valuation outcomes.
- Flexible Options: Tailor key inputs such as growth estimates, WACC, and tax rates to fit your assessments.
- Efficient: Pre-configured calculations save you the hassle of building from the ground up.
- Expert-Level Tool: Created for investors, analysts, and consultants alike.
- Easy to Use: User-friendly design and clear instructions make it accessible for everyone.
Who Can Benefit from VusionGroup (VUPA)?
- Professional Investors: Develop comprehensive and accurate valuation models for portfolio evaluation.
- Corporate Finance Teams: Assess valuation scenarios to inform strategic decision-making.
- Consultants and Advisors: Deliver precise valuation insights for clients investing in VusionGroup (VUPA).
- Students and Educators: Leverage real-world data for hands-on experience in financial modeling and teaching.
- Tech Enthusiasts: Gain insights into the market valuation of innovative companies like VusionGroup (VUPA).
What the Template Includes
- Pre-Filled DCF Model: VusionGroup’s financial data integrated for immediate application.
- WACC Calculator: Comprehensive calculations for the Weighted Average Cost of Capital.
- Financial Ratios: Analyze VusionGroup’s profitability, leverage, and operational efficiency.
- Editable Inputs: Adjust assumptions like growth rates, margins, and CAPEX to tailor to your scenarios.
- Financial Statements: Access annual and quarterly reports for thorough analysis.
- Interactive Dashboard: Effortlessly visualize essential valuation metrics and outcomes.
Disclaimer
All information, articles, and product details provided on this website are for general informational and educational purposes only. We do not claim any ownership over, nor do we intend to infringe upon, any trademarks, copyrights, logos, brand names, or other intellectual property mentioned or depicted on this site. Such intellectual property remains the property of its respective owners, and any references here are made solely for identification or informational purposes, without implying any affiliation, endorsement, or partnership.
We make no representations or warranties, express or implied, regarding the accuracy, completeness, or suitability of any content or products presented. Nothing on this website should be construed as legal, tax, investment, financial, medical, or other professional advice. In addition, no part of this site—including articles or product references—constitutes a solicitation, recommendation, endorsement, advertisement, or offer to buy or sell any securities, franchises, or other financial instruments, particularly in jurisdictions where such activity would be unlawful.
All content is of a general nature and may not address the specific circumstances of any individual or entity. It is not a substitute for professional advice or services. Any actions you take based on the information provided here are strictly at your own risk. You accept full responsibility for any decisions or outcomes arising from your use of this website and agree to release us from any liability in connection with your use of, or reliance upon, the content or products found herein.