
|
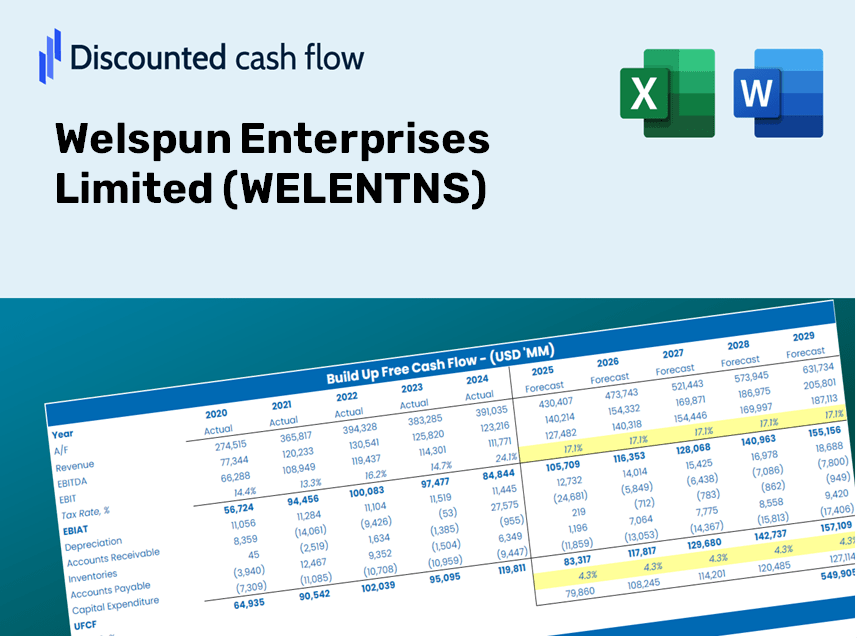
Valoración DCF de Welspun Enterprises Limited (Welent.NS) |
Completamente Editable: Adáptelo A Sus Necesidades En Excel O Sheets
Diseño Profesional: Plantillas Confiables Y Estándares De La Industria
Predeterminadas Para Un Uso Rápido Y Eficiente
Compatible con MAC / PC, completamente desbloqueado
No Se Necesita Experiencia; Fáciles De Seguir
Welspun Enterprises Limited (WELENT.NS) Bundle
¡Mejore sus estrategias de inversión con la calculadora DCF (Welentns)! Sumérgete en las empresas auténticas de Welspun Limited Financials, ajusta las proyecciones y gastos de crecimiento, y observa cómo estas modificaciones afectan el valor intrínseco de (Welentns) en tiempo real.
Discounted Cash Flow (DCF) - (USD MM)
| Year | AY1 2021 |
AY2 2022 |
AY3 2023 |
AY4 2024 |
AY5 2025 |
FY1 2026 |
FY2 2027 |
FY3 2028 |
FY4 2029 |
FY5 2030 |
|---|---|---|---|---|---|---|---|---|---|---|
| Revenue | 15,293.6 | 13,362.3 | 27,581.9 | 28,722.8 | 35,841.0 | 46,260.9 | 59,710.2 | 77,069.6 | 99,475.7 | 128,396.0 |
| Revenue Growth, % | 0 | -12.63 | 106.42 | 4.14 | 24.78 | 29.07 | 29.07 | 29.07 | 29.07 | 29.07 |
| EBITDA | 3,134.1 | 2,070.7 | 8,740.8 | 6,164.7 | 5,216.9 | 9,594.4 | 12,383.7 | 15,984.0 | 20,630.9 | 26,628.9 |
| EBITDA, % | 20.49 | 15.5 | 31.69 | 21.46 | 14.56 | 20.74 | 20.74 | 20.74 | 20.74 | 20.74 |
| Depreciation | 159.9 | 159.3 | 131.0 | 275.6 | 509.0 | 471.2 | 608.1 | 784.9 | 1,013.1 | 1,307.7 |
| Depreciation, % | 1.05 | 1.19 | 0.47495 | 0.95952 | 1.42 | 1.02 | 1.02 | 1.02 | 1.02 | 1.02 |
| EBIT | 2,974.2 | 1,911.4 | 8,609.8 | 5,889.1 | 4,707.9 | 9,123.2 | 11,775.6 | 15,199.0 | 19,617.8 | 25,321.2 |
| EBIT, % | 19.45 | 14.3 | 31.22 | 20.5 | 13.14 | 19.72 | 19.72 | 19.72 | 19.72 | 19.72 |
| Total Cash | 3,620.9 | 3,490.7 | 17,813.8 | 7,344.3 | 11,068.9 | 15,806.2 | 20,401.5 | 26,332.7 | 33,988.4 | 43,869.7 |
| Total Cash, percent | .0 | .0 | .0 | .0 | .0 | .0 | .0 | .0 | .0 | .0 |
| Account Receivables | 6,151.7 | 7,831.3 | 11,708.7 | 11,696.9 | 14,911.2 | 20,688.7 | 26,703.5 | 34,466.9 | 44,487.4 | 57,421.1 |
| Account Receivables, % | 40.22 | 58.61 | 42.45 | 40.72 | 41.6 | 44.72 | 44.72 | 44.72 | 44.72 | 44.72 |
| Inventories | 48.9 | 480.7 | 2,789.8 | 3,733.1 | 1,626.4 | 2,920.6 | 3,769.7 | 4,865.6 | 6,280.2 | 8,106.0 |
| Inventories, % | 0.31974 | 3.6 | 10.11 | 13 | 4.54 | 6.31 | 6.31 | 6.31 | 6.31 | 6.31 |
| Accounts Payable | 3,294.3 | 4,082.6 | 5,850.6 | 4,630.5 | 8,473.6 | 10,461.3 | 13,502.7 | 17,428.3 | 22,495.2 | 29,035.2 |
| Accounts Payable, % | 21.54 | 30.55 | 21.21 | 16.12 | 23.64 | 22.61 | 22.61 | 22.61 | 22.61 | 22.61 |
| Capital Expenditure | -7,473.3 | -4,358.3 | -1,556.9 | -703.2 | -516.0 | -8,420.8 | -10,869.0 | -14,028.9 | -18,107.5 | -23,371.8 |
| Capital Expenditure, % | -48.87 | -32.62 | -5.64 | -2.45 | -1.44 | -18.2 | -18.2 | -18.2 | -18.2 | -18.2 |
| Tax Rate, % | 37.97 | 37.97 | 37.97 | 37.97 | 37.97 | 37.97 | 37.97 | 37.97 | 37.97 | 37.97 |
| EBITAT | 2,134.7 | 2,261.2 | 8,393.0 | 3,631.5 | 2,920.4 | 7,169.9 | 9,254.4 | 11,945.0 | 15,417.7 | 19,900.0 |
| Depreciation | ||||||||||
| Changes in Account Receivables | ||||||||||
| Changes in Inventories | ||||||||||
| Changes in Accounts Payable | ||||||||||
| Capital Expenditure | ||||||||||
| UFCF | -8,085.0 | -3,260.9 | 2,548.6 | 1,052.3 | 5,648.9 | -5,863.7 | -4,828.9 | -6,232.8 | -8,044.8 | -10,383.7 |
| WACC, % | 5.15 | 5.64 | 5.59 | 4.98 | 4.99 | 5.27 | 5.27 | 5.27 | 5.27 | 5.27 |
| PV UFCF | ||||||||||
| SUM PV UFCF | -29,853.2 | |||||||||
| Long Term Growth Rate, % | 0.50 | |||||||||
| Free cash flow (T + 1) | -10,436 | |||||||||
| Terminal Value | -218,763 | |||||||||
| Present Terminal Value | -169,217 | |||||||||
| Enterprise Value | -199,071 | |||||||||
| Net Debt | 8,563 | |||||||||
| Equity Value | -207,634 | |||||||||
| Diluted Shares Outstanding, MM | 138 | |||||||||
| Equity Value Per Share | -1,499.83 |
What You Will Receive
- Customizable Excel Template: A fully adjustable Excel-based DCF Calculator featuring pre-filled real WELENTNS financials.
- Authentic Data: Access to historical figures and future projections (highlighted in the yellow cells).
- Flexible Forecasting: Modify key assumptions such as revenue growth, EBITDA %, and WACC.
- Instant Calculations: Quickly observe how your inputs affect the valuation of Welspun Enterprises Limited.
- Professional Resource: Designed for investors, CFOs, consultants, and financial analysts.
- User-Friendly Interface: Organized for simplicity and ease of navigation, complete with step-by-step guidance.
Key Features
- Comprehensive WELENTNS Data: Pre-loaded with Welspun Enterprises Limited's historical financial performance and future projections.
- Fully Customizable Inputs: Tailor revenue growth, profit margins, weighted average cost of capital (WACC), tax rates, and capital expenditures to your preferences.
- Dynamic Valuation Model: Automatically refreshes Net Present Value (NPV) and intrinsic value based on your customized inputs.
- Scenario Testing: Develop various forecasting scenarios to evaluate diverse valuation results.
- User-Friendly Design: Intuitive and organized layout suitable for both professionals and newcomers.
How It Works
- 1. Access the Template: Download and open the Excel file containing Welspun Enterprises Limited’s ([WELENTNS]) preloaded data.
- 2. Adjust Assumptions: Modify key inputs such as growth rates, WACC, and capital expenditures.
- 3. View Results Instantly: The DCF model automatically computes intrinsic value and NPV for you.
- 4. Explore Scenarios: Evaluate multiple forecasts to assess various valuation outcomes.
- 5. Present with Confidence: Deliver professional valuation insights to back your decisions.
Why Choose This Calculator for Welspun Enterprises Limited (WELENTNS)?
- User-Friendly Interface: Tailored for both novices and seasoned users.
- Customizable Assumptions: Effortlessly adjust inputs to suit your financial analysis.
- Real-Time Adjustments: Monitor immediate updates to Welspun’s valuation as you tweak parameters.
- Plug-and-Play: Comes preloaded with Welspun’s latest financial metrics for fast evaluation.
- Preferred by Experts: Utilized by investors and analysts for making well-informed choices.
Who Can Benefit from This Product?
- Finance Students: Master valuation methods and apply them using real-world data.
- Academics: Integrate industry-standard models into your lectures or research projects.
- Investors: Validate your investment hypotheses and evaluate valuation results for Welspun Enterprises Limited (WELENTNS).
- Analysts: Enhance your efficiency with a ready-to-use, customizable DCF model.
- Small Business Owners: Understand the analytical approaches used for large public firms like Welspun Enterprises Limited.
What the Template Contains
- Historical Data: Contains Welspun Enterprises Limited's past financial performance and foundational forecasts.
- DCF and Levered DCF Models: Comprehensive templates designed to estimate the intrinsic value of Welspun Enterprises Limited (WELENTNS).
- WACC Sheet: Pre-configured calculations for the Weighted Average Cost of Capital.
- Editable Inputs: Customize essential drivers such as growth rates, EBITDA percentages, and CAPEX assumptions.
- Quarterly and Annual Statements: A thorough analysis of Welspun Enterprises Limited's financial data.
- Interactive Dashboard: Dynamically visualize valuation outcomes and forecasts.
Disclaimer
All information, articles, and product details provided on this website are for general informational and educational purposes only. We do not claim any ownership over, nor do we intend to infringe upon, any trademarks, copyrights, logos, brand names, or other intellectual property mentioned or depicted on this site. Such intellectual property remains the property of its respective owners, and any references here are made solely for identification or informational purposes, without implying any affiliation, endorsement, or partnership.
We make no representations or warranties, express or implied, regarding the accuracy, completeness, or suitability of any content or products presented. Nothing on this website should be construed as legal, tax, investment, financial, medical, or other professional advice. In addition, no part of this site—including articles or product references—constitutes a solicitation, recommendation, endorsement, advertisement, or offer to buy or sell any securities, franchises, or other financial instruments, particularly in jurisdictions where such activity would be unlawful.
All content is of a general nature and may not address the specific circumstances of any individual or entity. It is not a substitute for professional advice or services. Any actions you take based on the information provided here are strictly at your own risk. You accept full responsibility for any decisions or outcomes arising from your use of this website and agree to release us from any liability in connection with your use of, or reliance upon, the content or products found herein.