
|
Valoración DCF de Westlake Chemical Partners LP (WLKP) |
Completamente Editable: Adáptelo A Sus Necesidades En Excel O Sheets
Diseño Profesional: Plantillas Confiables Y Estándares De La Industria
Predeterminadas Para Un Uso Rápido Y Eficiente
Compatible con MAC / PC, completamente desbloqueado
No Se Necesita Experiencia; Fáciles De Seguir
Westlake Chemical Partners LP (WLKP) Bundle
¡Agilice su análisis y aumente la precisión con nuestra calculadora DCF (WLKP)! Impulsado por datos reales de Westlake Chemical Partners LP y supuestos personalizables, esta herramienta le permite pronosticar, analizar y valor (WLKP) como un inversor experimentado.
What You Will Receive
- Customizable Excel Template: A fully editable Excel-based DCF Calculator featuring pre-filled financial data for Westlake Chemical Partners LP (WLKP).
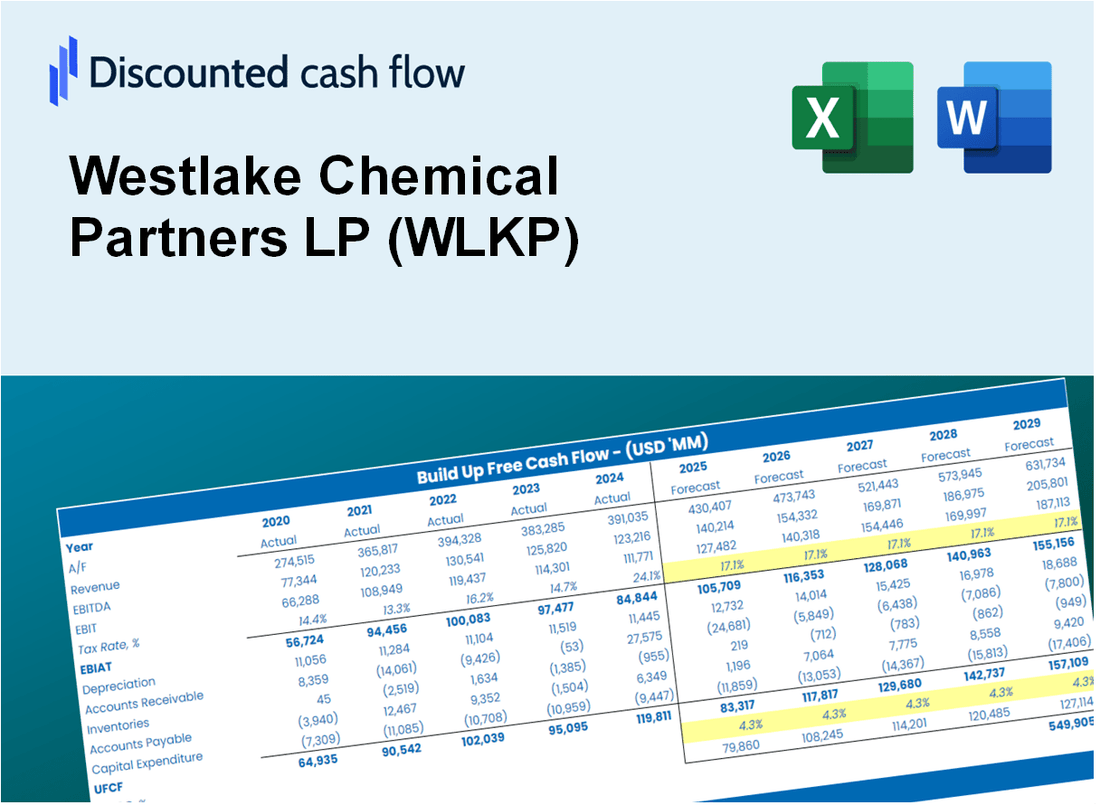
- Genuine Data: Access to historical performance metrics and forward-looking projections (highlighted in the yellow cells).
- Adjustable Forecasts: Modify assumptions such as revenue growth, EBITDA percentages, and WACC to suit your analysis.
- Instant Calculations: Quickly observe how your inputs affect the valuation of Westlake Chemical Partners LP (WLKP).
- Professional Resource: Designed for investors, CFOs, consultants, and financial analysts.
- Intuitive Layout: Organized for simplicity and ease of navigation, complete with step-by-step guidance.
Key Features
- Comprehensive WLKP Financials: Gain access to precise pre-loaded historical data and future forecasts for Westlake Chemical Partners LP (WLKP).
- Tailored Forecast Assumptions: Modify highlighted cells for key metrics such as WACC, growth rates, and profit margins.
- Real-Time Calculations: Enjoy automatic updates for DCF, Net Present Value (NPV), and cash flow evaluations.
- Interactive Dashboard: Utilize clear charts and summaries to effectively visualize your valuation outcomes.
- Suitable for All Skill Levels: An easy-to-navigate design crafted for investors, CFOs, and consultants alike.
How It Works
- 1. Access the Template: Download and open the Excel file containing Westlake Chemical Partners LP (WLKP) preloaded data.
- 2. Adjust Key Inputs: Modify essential parameters such as growth rates, WACC, and capital expenditures.
- 3. Analyze Results Instantly: The DCF model automatically computes intrinsic value and NPV for your analysis.
- 4. Explore Different Scenarios: Evaluate multiple forecasts to understand various valuation possibilities.
- 5. Present with Assurance: Deliver professional valuation insights to reinforce your strategic decisions.
Why Choose This Calculator for Westlake Chemical Partners LP (WLKP)?
- Accuracy: Utilizes real Westlake Chemical financials to ensure precise data.
- Flexibility: Tailored for users to easily test and adjust inputs as needed.
- Time-Saving: Eliminate the complexities of constructing a DCF model from the ground up.
- Professional-Grade: Crafted with the precision and usability expected by CFOs.
- User-Friendly: Intuitive design makes it accessible for users without deep financial modeling expertise.
Who Should Use This Product?
- Investors: Evaluate Westlake Chemical Partners LP’s (WLKP) market position before making investment decisions.
- CFOs and Financial Analysts: Optimize valuation methodologies and assess financial forecasts for (WLKP).
- Startup Founders: Understand the valuation strategies of established firms like Westlake Chemical Partners LP (WLKP).
- Consultants: Provide comprehensive valuation analyses and reports for clients involving (WLKP).
- Students and Educators: Utilize current data from (WLKP) to enhance learning and teaching of valuation principles.
What the Template Contains
- Comprehensive DCF Model: Editable template featuring thorough valuation calculations.
- Real-World Data: Westlake Chemical Partners LP’s (WLKP) historical and projected financials preloaded for analysis.
- Customizable Parameters: Modify WACC, growth rates, and tax assumptions to explore various scenarios.
- Financial Statements: Complete annual and quarterly breakdowns for enhanced insights.
- Key Ratios: Integrated analysis for profitability, efficiency, and leverage metrics.
- Dashboard with Visual Outputs: Charts and tables providing clear, actionable results.
Disclaimer
All information, articles, and product details provided on this website are for general informational and educational purposes only. We do not claim any ownership over, nor do we intend to infringe upon, any trademarks, copyrights, logos, brand names, or other intellectual property mentioned or depicted on this site. Such intellectual property remains the property of its respective owners, and any references here are made solely for identification or informational purposes, without implying any affiliation, endorsement, or partnership.
We make no representations or warranties, express or implied, regarding the accuracy, completeness, or suitability of any content or products presented. Nothing on this website should be construed as legal, tax, investment, financial, medical, or other professional advice. In addition, no part of this site—including articles or product references—constitutes a solicitation, recommendation, endorsement, advertisement, or offer to buy or sell any securities, franchises, or other financial instruments, particularly in jurisdictions where such activity would be unlawful.
All content is of a general nature and may not address the specific circumstances of any individual or entity. It is not a substitute for professional advice or services. Any actions you take based on the information provided here are strictly at your own risk. You accept full responsibility for any decisions or outcomes arising from your use of this website and agree to release us from any liability in connection with your use of, or reliance upon, the content or products found herein.