
|
Valoración DCF de Western New England Bancorp, Inc. (WNEB) |
Completamente Editable: Adáptelo A Sus Necesidades En Excel O Sheets
Diseño Profesional: Plantillas Confiables Y Estándares De La Industria
Predeterminadas Para Un Uso Rápido Y Eficiente
Compatible con MAC / PC, completamente desbloqueado
No Se Necesita Experiencia; Fáciles De Seguir
Western New England Bancorp, Inc. (WNEB) Bundle
Ya sea que usted sea un inversor o un analista, esta calculadora DCF (WNEB) es su recurso para una valoración precisa. Equipado con datos reales del oeste de Nueva Inglaterra Bancorp, Inc., puede ajustar previsiones y observar los efectos en tiempo real.
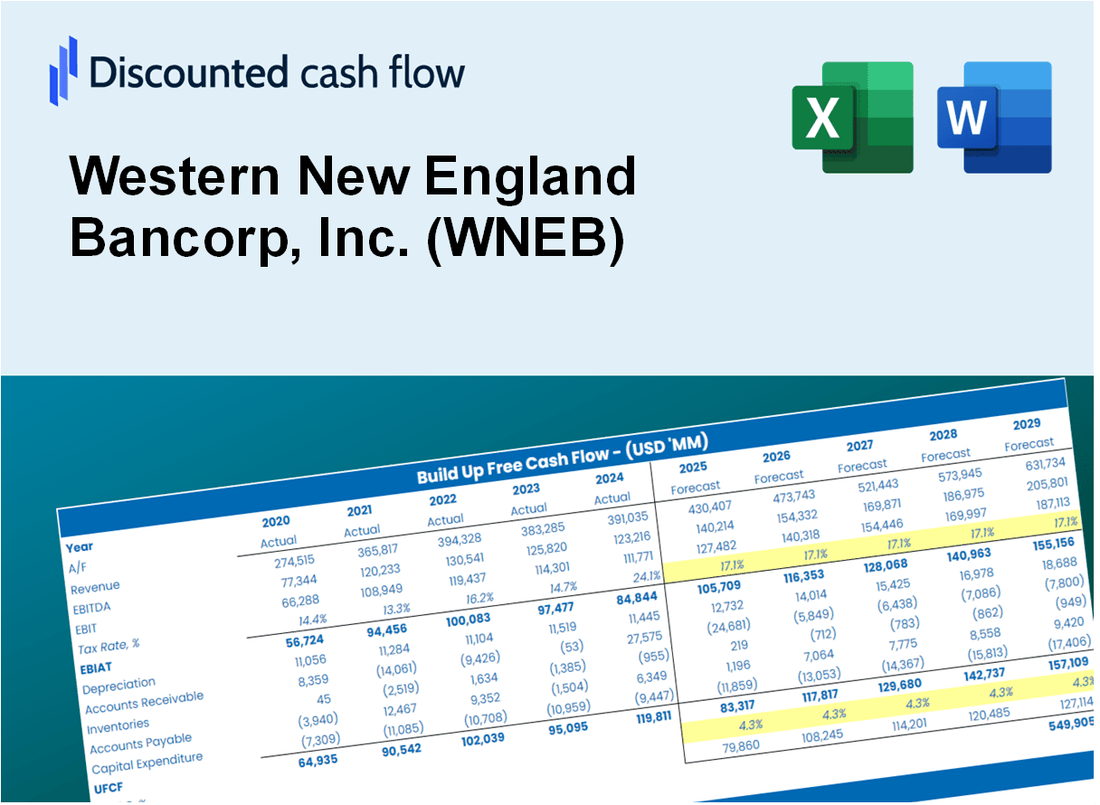
Discounted Cash Flow (DCF) - (USD MM)
| Year | AY1 2020 |
AY2 2021 |
AY3 2022 |
AY4 2023 |
AY5 2024 |
FY1 2025 |
FY2 2026 |
FY3 2027 |
FY4 2028 |
FY5 2029 |
|---|---|---|---|---|---|---|---|---|---|---|
| Revenue | 92.1 | 92.4 | 99.3 | 112.0 | 122.7 | 132.0 | 141.9 | 152.6 | 164.1 | 176.5 |
| Revenue Growth, % | 0 | 0.31153 | 7.41 | 12.85 | 9.57 | 7.54 | 7.54 | 7.54 | 7.54 | 7.54 |
| EBITDA | 16.7 | 34.4 | 37.3 | 22.2 | 17.6 | 33.5 | 36.1 | 38.8 | 41.7 | 44.9 |
| EBITDA, % | 18.1 | 37.25 | 37.59 | 19.8 | 14.31 | 25.41 | 25.41 | 25.41 | 25.41 | 25.41 |
| Depreciation | 2.5 | 2.7 | 2.7 | 2.6 | 2.6 | 3.4 | 3.6 | 3.9 | 4.2 | 4.5 |
| Depreciation, % | 2.74 | 2.92 | 2.71 | 2.32 | 2.12 | 2.56 | 2.56 | 2.56 | 2.56 | 2.56 |
| EBIT | 14.2 | 31.7 | 34.6 | 19.6 | 15.0 | 30.2 | 32.4 | 34.9 | 37.5 | 40.3 |
| EBIT, % | 15.37 | 34.33 | 34.89 | 17.48 | 12.19 | 22.85 | 22.85 | 22.85 | 22.85 | 22.85 |
| Total Cash | 286.3 | 292.9 | 175.7 | 163.0 | 217.9 | 132.0 | 141.9 | 152.6 | 164.1 | 176.5 |
| Total Cash, percent | .0 | .0 | .0 | .0 | .0 | .0 | .0 | .0 | .0 | .0 |
| Account Receivables | 8.5 | 7.8 | 8.1 | 8.5 | 8.5 | 10.6 | 11.4 | 12.3 | 13.2 | 14.2 |
| Account Receivables, % | 9.2 | 8.41 | 8.2 | 7.61 | 6.9 | 8.07 | 8.07 | 8.07 | 8.07 | 8.07 |
| Inventories | .0 | .0 | .0 | .0 | .0 | .0 | .0 | .0 | .0 | .0 |
| Inventories, % | 0 | 0 | 0 | 0 | 0 | 0 | 0 | 0 | 0 | 0 |
| Accounts Payable | .0 | .0 | .0 | .0 | .0 | .0 | .0 | .0 | .0 | .0 |
| Accounts Payable, % | 0 | 0 | 0 | 0 | 0 | 0 | 0 | 0 | 0 | 0 |
| Capital Expenditure | -3.6 | -3.5 | -1.1 | -2.9 | -1.2 | -3.3 | -3.5 | -3.8 | -4.1 | -4.4 |
| Capital Expenditure, % | -3.89 | -3.74 | -1.15 | -2.59 | -0.97441 | -2.47 | -2.47 | -2.47 | -2.47 | -2.47 |
| Tax Rate, % | 22 | 22 | 22 | 22 | 22 | 22 | 22 | 22 | 22 | 22 |
| EBITAT | 11.2 | 23.7 | 25.9 | 15.1 | 11.7 | 23.1 | 24.9 | 26.8 | 28.8 | 30.9 |
| Depreciation | ||||||||||
| Changes in Account Receivables | ||||||||||
| Changes in Inventories | ||||||||||
| Changes in Accounts Payable | ||||||||||
| Capital Expenditure | ||||||||||
| UFCF | 1.7 | 23.6 | 27.1 | 14.4 | 13.1 | 21.1 | 24.2 | 26.0 | 28.0 | 30.1 |
| WACC, % | 15.79 | 15.18 | 15.18 | 15.48 | 15.62 | 15.45 | 15.45 | 15.45 | 15.45 | 15.45 |
| PV UFCF | ||||||||||
| SUM PV UFCF | 83.8 | |||||||||
| Long Term Growth Rate, % | 2.00 | |||||||||
| Free cash flow (T + 1) | 31 | |||||||||
| Terminal Value | 228 | |||||||||
| Present Terminal Value | 111 | |||||||||
| Enterprise Value | 195 | |||||||||
| Net Debt | 66 | |||||||||
| Equity Value | 129 | |||||||||
| Diluted Shares Outstanding, MM | 21 | |||||||||
| Equity Value Per Share | 6.15 |
What You Will Get
- Real WNEB Data: Preloaded financials – from revenue to EBIT – based on actual and projected figures.
- Full Customization: Adjust all critical parameters (yellow cells) like WACC, growth %, and tax rates.
- Instant Valuation Updates: Automatic recalculations to analyze the impact of changes on WNEB’s fair value.
- Versatile Excel Template: Tailored for quick edits, scenario testing, and detailed projections.
- Time-Saving and Accurate: Skip building models from scratch while maintaining precision and flexibility.
Key Features
- Comprehensive DCF Calculator: Offers detailed unlevered and levered DCF valuation models tailored for Western New England Bancorp, Inc. (WNEB).
- WACC Calculator: Features a pre-built Weighted Average Cost of Capital sheet with adjustable inputs specific to the banking sector.
- Customizable Forecast Assumptions: Easily modify growth rates, capital expenditures, and discount rates to fit WNEB's financial strategy.
- Integrated Financial Ratios: Evaluate profitability, leverage, and efficiency ratios for Western New England Bancorp, Inc. (WNEB).
- Interactive Dashboard and Charts: Visual representations summarize essential valuation metrics for straightforward analysis.
How It Works
- Step 1: Download the Excel file for Western New England Bancorp, Inc. (WNEB).
- Step 2: Review the pre-filled financial data and forecasts for (WNEB).
- Step 3: Adjust key inputs such as revenue growth, WACC, and tax rates (highlighted cells).
- Step 4: Observe the DCF model update in real-time as you modify assumptions.
- Step 5: Evaluate the outputs and apply the results to your investment strategies.
Why Choose Western New England Bancorp, Inc. (WNEB)?
- Save Time: Skip the lengthy processes – our services are ready for immediate use.
- Enhance Accuracy: Dependable financial insights and methodologies minimize valuation errors.
- Fully Customizable: Adjust our offerings to align with your specific assumptions and forecasts.
- Easy to Understand: Intuitive reports and visuals simplify result analysis.
- Endorsed by Professionals: Crafted for experts who prioritize accuracy and functionality.
Who Should Use This Product?
- Investors: Accurately assess Western New England Bancorp, Inc. (WNEB)'s fair value prior to making investment choices.
- CFOs: Utilize a top-tier DCF model for comprehensive financial reporting and analysis.
- Consultants: Efficiently tailor the template for client valuation reports.
- Entrepreneurs: Acquire insights into financial modeling practices employed by leading banks.
- Educators: Implement it as a teaching resource to illustrate valuation techniques.
What the Template Contains
- Operating and Balance Sheet Data: Pre-filled Western New England Bancorp, Inc. (WNEB) historical data and forecasts, including revenue, EBITDA, EBIT, and capital expenditures.
- WACC Calculation: A dedicated sheet for Weighted Average Cost of Capital (WACC), including parameters like Beta, risk-free rate, and share price.
- DCF Valuation (Unlevered and Levered): Editable Discounted Cash Flow models showing intrinsic value with detailed calculations.
- Financial Statements: Pre-loaded financial statements (annual and quarterly) to support analysis.
- Key Ratios: Includes profitability, leverage, and efficiency ratios for Western New England Bancorp, Inc. (WNEB).
- Dashboard and Charts: Visual summary of valuation outputs and assumptions to analyze results easily.
Disclaimer
All information, articles, and product details provided on this website are for general informational and educational purposes only. We do not claim any ownership over, nor do we intend to infringe upon, any trademarks, copyrights, logos, brand names, or other intellectual property mentioned or depicted on this site. Such intellectual property remains the property of its respective owners, and any references here are made solely for identification or informational purposes, without implying any affiliation, endorsement, or partnership.
We make no representations or warranties, express or implied, regarding the accuracy, completeness, or suitability of any content or products presented. Nothing on this website should be construed as legal, tax, investment, financial, medical, or other professional advice. In addition, no part of this site—including articles or product references—constitutes a solicitation, recommendation, endorsement, advertisement, or offer to buy or sell any securities, franchises, or other financial instruments, particularly in jurisdictions where such activity would be unlawful.
All content is of a general nature and may not address the specific circumstances of any individual or entity. It is not a substitute for professional advice or services. Any actions you take based on the information provided here are strictly at your own risk. You accept full responsibility for any decisions or outcomes arising from your use of this website and agree to release us from any liability in connection with your use of, or reliance upon, the content or products found herein.