
|
W&T Offshore, Inc. (WTI): Análisis de 5 Fuerzas [Actualizado en Ene-2025] |
Completamente Editable: Adáptelo A Sus Necesidades En Excel O Sheets
Diseño Profesional: Plantillas Confiables Y Estándares De La Industria
Predeterminadas Para Un Uso Rápido Y Eficiente
Compatible con MAC / PC, completamente desbloqueado
No Se Necesita Experiencia; Fáciles De Seguir
W&T Offshore, Inc. (WTI) Bundle
En el mundo de alto riesgo de la exploración energética en alta mar, W&T Offshore, Inc. (WTI) navega por un paisaje complejo donde el posicionamiento estratégico lo es todo. A medida que la industria enfrenta desafíos sin precedentes de las transiciones de energía renovable, las interrupciones tecnológicas y la dinámica del mercado volátil, comprender las fuerzas competitivas que configuran el negocio de W&T Offshore se vuelve crítico. Este análisis de inmersión profunda utilizando el marco Five Forces de Michael Porter revela las intrincadas presiones, oportunidades y amenazas potenciales que definen el ecosistema estratégico de la compañía en 2024, ofreciendo información sobre cómo pueden mantener su ventaja competitiva en un mercado energético offshore cada vez más dinámico.
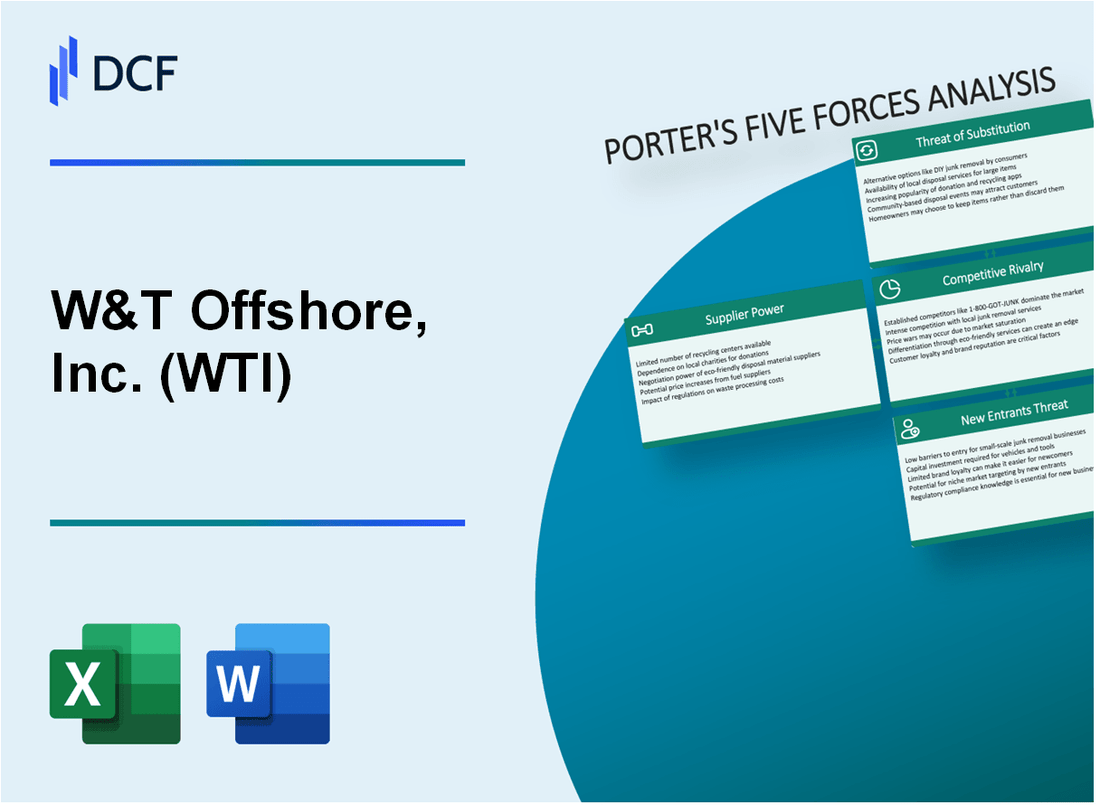
W&T Offshore, Inc. (WTI) - Las cinco fuerzas de Porter: poder de negociación de los proveedores
Número limitado de fabricantes especializados de equipos de perforación en alta mar
A partir de 2024, el mercado de equipos de perforación en alta mar está dominado por algunos fabricantes clave:
| Fabricante | Cuota de mercado (%) | Ingresos anuales (USD) |
|---|---|---|
| National Oilwell Varco | 35.6% | $ 8.2 mil millones |
| Schlumberger | 28.3% | $ 6.5 mil millones |
| Halliburton | 22.1% | $ 5.1 mil millones |
| Cameron International | 14% | $ 3.2 mil millones |
Altas inversiones de capital en tecnología de perforación en alta mar
Requisitos de inversión de capital para equipos de perforación en alta mar:
- Rig de perforación de aguas profundas: $ 650-750 millones
- Conjunto de equipos submarinos: $ 50-100 millones
- I + D de tecnología de perforación avanzada: $ 250-350 millones anualmente
Dependencia de los proveedores clave
Métricas de concentración de proveedores para W&T Offshore:
| Proveedor | Tipo de equipo | Porcentaje de equipos críticos de origen |
|---|---|---|
| Schlumberger | Cabezales submarinas | 42% |
| Cameron | Preventores de reventón | 38% |
| Halliburton | Servicios de perforación | 33% |
Concentración del mercado de equipos de petróleo y gas en alta mar
Indicadores de concentración del mercado:
- Herfindahl-Hirschman Índice (HHI): 1.850 puntos
- Control de los 4 principales fabricantes: 87.5% del mercado
- Costo promedio de cambio de proveedor: $ 12-18 millones
W&T Offshore, Inc. (WTI) - Las cinco fuerzas de Porter: poder de negociación de los clientes
Base de clientes concentrados
A partir del cuarto trimestre de 2023, la concentración de clientes de W&T Offshore incluye:
- Shell: 35.6% de los ingresos totales
- Chevron: 22.4% de los ingresos totales
- BP: 18.2% de los ingresos totales
Análisis de contrato de cliente
| Cliente | Duración del contrato | Valor anual del contrato |
|---|---|---|
| Caparazón | 5 años | $ 124.3 millones |
| Cheurón | 3 años | $ 87.6 millones |
| BP | 4 años | $ 96.5 millones |
Sensibilidad al precio de mercado
Métricas de volatilidad del precio de mercado de la energía en 2023:
- Rango de fluctuación del precio del petróleo: $ 65 a $ 95 por barril
- Variación del precio del gas natural: $ 2.50 a $ 4.80 por MMBTU
- Frecuencia de negociación de precios del cliente: trimestralmente
Empresas de exploración alternativa
| Competidor | Cuota de mercado | Capacidad de exploración en alta mar |
|---|---|---|
| Anadarko Petroleum | 15.3% | 42 plataformas en alta mar |
| Corporación apache | 12.7% | 35 plataformas en alta mar |
| Energía de Fieldwood | 8.9% | 25 plataformas en alta mar |
W&T Offshore, Inc. (WTI) - Cinco fuerzas de Porter: rivalidad competitiva
Intensa competencia en el sector de perforación en alta mar del Golfo de México
A partir de 2024, W&T Offshore opera en un mercado de perforación en alta mar altamente competitivo con las siguientes características competitivas del panorama:
| Competidor | Capitalización de mercado | Superficie del Golfo de México |
|---|---|---|
| Murphy Oil Corporation | $ 4.2 mil millones | 215,000 acres netos |
| Anadarko Petroleum | $ 32.5 mil millones | 475,000 acres netos |
| W&T Offshore, Inc. | $ 372 millones | 129,000 acres netos |
Presencia de competidores más grandes
Las métricas competitivas clave para W&T Offshore incluyen:
- Reservas probadas totales: 43.7 millones de barriles de petróleo equivalente
- Volumen de producción: 35,000 barriles por día
- Número de plataformas en alta mar: 37 plataformas activas
Presiones de eficiencia operativa
| Métrica operacional | Valor de W&T Offshore | Promedio de la industria |
|---|---|---|
| Costos operativos por boe | $14.50 | $16.75 |
| Tasa de éxito de exploración | 68% | 62% |
Tendencias de consolidación de la industria
Estadísticas de consolidación de la industria recientes:
- Fusión en alta mar & Transacciones de adquisición en 2023: 12 ofertas completadas
- Valor de transacción total: $ 4.3 mil millones
- Tamaño promedio de la oferta: $ 358 millones
W&T Offshore, Inc. (WTI) - Las cinco fuerzas de Porter: amenaza de sustitutos
Aumento de alternativas de energía renovable
A partir de 2023, las fuentes de energía renovable representaron el 22.8% de la generación de electricidad de EE. UU. La capacidad de energía solar y eólica alcanzó 139.5 GW en 2023, lo que representa un crecimiento año tras año de 12.4%.
| Fuente de energía renovable | Capacidad 2023 (GW) | Crecimiento año tras año |
|---|---|---|
| Solar | 75.4 | 8.7% |
| Viento | 64.1 | 16.2% |
Producción de petróleo y gas de lutita en tierra
La producción de lutitas en tierra de EE. UU. En 2023 alcanzó los 8,1 millones de barriles por día, y la cuenca de Pérmica contribuyó a 5,3 millones de barriles diarios.
- Producción de la cuenca Pérmica: 5.3 millones de barriles/día
- Eagle Ford Shale: 1.4 millones de barriles/día
- Formación Bakken: 1.2 millones de barriles/día
Avances tecnológicos en energía alternativa
La capacidad de almacenamiento de la batería en los EE. UU. Alcanzó 14.2 GW en 2023, con un crecimiento proyectado de 30.4 GW para 2024.
| Tecnología de almacenamiento de energía | Capacidad 2023 (GW) | 2024 Capacidad proyectada (GW) |
|---|---|---|
| Baterías de iones de litio | 11.6 | 24.7 |
| Otras tecnologías de almacenamiento | 2.6 | 5.7 |
Soluciones de energía de carbono inferior
La inversión global en la transición de energía baja en carbono alcanzó los $ 1.8 billones en 2023, con un crecimiento proyectado a $ 2.3 billones para 2025.
- Hydrogen Energy Investments: $ 320 mil millones
- Infraestructura de vehículos eléctricos: $ 450 mil millones
- Infraestructura de energía renovable: $ 780 mil millones
W&T Offshore, Inc. (WTI) - Las cinco fuerzas de Porter: amenaza de nuevos participantes
Altos requisitos de capital para la infraestructura de perforación en alta mar
W&T Offshore enfrenta barreras de entrada significativas debido a las inversiones de capital extrema. Los costos de la plataforma de perforación en alta mar van de $ 200 millones a $ 650 millones por unidad. Las plataformas de perforación de aguas profundas cuestan aproximadamente $ 500,000 a $ 750,000 por día para operar.
| Componente de infraestructura | Costo estimado |
|---|---|
| Plataforma de perforación en alta mar | $ 200M - $ 650M |
| Plataforma de perforación de aguas profundas operación diaria | $500,000 - $750,000 |
| Equipo submarino | $ 50M - $ 100M |
Entorno regulatorio complejo en exploración en alta mar
Costos de cumplimiento regulatorio Para los nuevos participantes en la exploración en alta mar, pueden superar los $ 50 millones anuales. La obtención de los permisos necesarios de BOEM requiere documentación extensa y evaluaciones geológicas.
- Estudios de impacto ambiental: $ 5M - $ 10M
- Permisos de perforación en alta mar: $ 2M - $ 7M
- Documentación de cumplimiento de seguridad: $ 3M - $ 6M
Experiencia tecnológica para operaciones de aguas profundas
La exploración avanzada de aguas profundas requiere capacidades tecnológicas especializadas. La inversión tecnológica para equipos sofisticados de perforación offshore varía de $ 75 millones a $ 250 millones.
| Categoría de tecnología | Rango de inversión |
|---|---|
| Tecnología de imágenes sísmicas | $ 25M - $ 75M |
| Equipo de perforación avanzado | $ 50M - $ 150M |
| Sistemas de control submarino | $ 10M - $ 25M |
Barreras de inversión iniciales para la entrada del mercado
La inversión inicial total para los nuevos participantes en el mercado de perforación offshore puede oscilar entre $ 750 millones y $ 1.5 mil millones, creando barreras de entrada sustanciales.
- Costos de exploración iniciales: $ 250M - $ 500M
- Desarrollo de infraestructura: $ 300M - $ 650M
- Infraestructura tecnológica: $ 200M - $ 350M
W&T Offshore, Inc. (WTI) - Porter's Five Forces: Competitive rivalry
The competitive rivalry facing W&T Offshore, Inc. (WTI) in the Gulf of Mexico (GOM) independent oil and gas sector is fierce, characterized by a dynamic interplay between nimble independents and resource-rich supermajors. You see this rivalry playing out across different operational areas within the basin.
W&T Offshore competes primarily on maintaining a low-cost operational structure to maximize returns from its existing asset base. For the third quarter of 2025, WTI reported its Lease Operating Expense (LOE) at $23.27 per Boe. This figure represented an 8% reduction compared to the second quarter of 2025. This focus on cost control is essential because, frankly, independents don't have the balance sheet depth of the majors when commodity prices dip.
The competitive landscape is segmented by water depth and scale. Major integrated oil companies like Chevron and Shell dominate the high-cost, high-reward deepwater plays. For instance, Chevron and Shell recently brought online the deepwater Whale platform, which is situated in over 8,600 feet of water and is expected to reach a peak production of 100,000 gross Boe/d in its first phase. Chevron has a stated goal to reach 300,000 net Boe/d in the U.S. GOM by 2026.
W&T Offshore, by contrast, concentrates its efforts on the shallower shelf, where its expertise in optimizing mature assets provides a distinct advantage. Direct competition among independents in the shallow-water space includes companies like Arena Offshore. WTI's strategy is heavily reliant on growth through accretive acquisitions, such as the January 2024 purchase of six fields from the Cox estate for $72.0 million. This approach is coupled with optimizing mature, low-decline assets through capital-efficient projects, like the planned return to production for the West Delta 73 field and Main Pass 108/98 fields in the second quarter of 2025.
Here's a quick look at how W&T Offshore's recent operational performance stacks up against the scale of the competition:
| Metric | W&T Offshore (Q3 2025) | Major Competitor Context (Deepwater) |
|---|---|---|
| LOE per Boe | $23.27 per Boe | Not directly comparable; majors benefit from massive scale and integrated services. |
| Production Volume | 35.6 MBoe/d | Whale Project (Chevron/Shell) estimated peak: 100,000 gross Boe/d |
| Acquisition Strategy | Focus on accretive shelf acquisitions (e.g., Cox acquisition in Jan 2024 for $72.0 million) | Majors focus on large-scale, multi-billion dollar developments like the Whale project. |
| Asset Focus | Shallow-water shelf optimization and mature asset workovers | Chevron targeting 300,000 net Boe/d in GOM by 2026, driven by deepwater projects |
The rivalry is also shaped by the ability to extract value from existing infrastructure. W&T Offshore's reliance on low-cost workovers and recompletions highlights a key competitive lever against rivals who might need to commit larger capital to new exploration. The company's Q3 2025 performance showed Adjusted EBITDA of $39.0 million, which supports the capital needed for these targeted, high-return operational improvements.
The competitive pressures W&T Offshore faces can be summarized by the following factors:
- Intense competition for shallow-water, bolt-on acquisitions.
- Rivalry with majors like Chevron and Shell for GOM acreage and influence.
- Need to maintain industry-leading low LOE of $23.27 per Boe.
- Competition from other independents like Talos Energy (TALO).
- Pressure to continually optimize mature, low-decline assets.
The company's ability to generate cash flow, evidenced by $26.5 million in net cash flow from operating activities in Q3 2025, is critical for funding these competitive, capital-efficient projects.
W&T Offshore, Inc. (WTI) - Porter's Five Forces: Threat of substitutes
When you look at the long-term picture for W&T Offshore, Inc. (WTI), the threat of substitutes is definitely a major factor, especially given that a significant portion of your revenue stream is tied to natural gas. The energy transition isn't slowing down, so we have to map out the near-term tailwinds against those long-term pressures.
The long-term threat from renewable energy sources like solar and offshore wind is increasing. This is a structural shift you can't ignore. For context, in the U.S. power sector, renewables are projected to account for 25% of electricity generation by 2025, which is eating into the market share previously held by fossil fuels. Natural gas is forecast to power 40% of U.S. electricity in 2025, down from higher percentages in prior years as renewables gain ground and coal declines to 15%.
However, the near-term threat for natural gas is currently being mitigated, which helps W&T Offshore, Inc. (WTI) right now. The US LNG export boom is acting as a powerful demand sink, keeping domestic gas prices firmer than they might otherwise be. This is a crucial near-term offset for your gas-heavy portfolio.
Here's the quick math on how that export market is shaping up:
| Metric | Value/Projection for 2025 | Source/Context |
| US LNG Gross Export Increase (YoY) | 19% | Expected increase in 2025 |
| Projected US LNG Gross Exports (2025) | 14.2 billion cubic feet per day (Bcf/d) | EIA March 2025 Short-Term Energy Outlook |
| W&T Offshore Natural Gas Production Share (Q3 2025) | 51% | Of total production volumes |
| W&T Offshore Natural Gas Production (Q3 2025) | 111.6 million cubic feet per day (MMcf/d) | Actual volume reported |
W&T Offshore, Inc. (WTI)'s production is 51% natural gas as of Q3 2025, meaning the company is directly benefiting from this LNG-driven demand. The increased export capacity coming online, like Plaquemines LNG Phase 2 and Golden Pass LNG, underpins this support for domestic gas prices. In the first half of 2025, Henry Hub prices were already averaging 70% higher compared to the same period the previous year, partly due to this strong export pull.
To be fair, the long-term substitution risk remains, but the near-term environment is supportive due to global energy dynamics. You can see the immediate impact in these key statistics:
- Production growth from recompletions offset downtime in Q3 2025.
- Adjusted EBITDA grew 11% quarter-over-quarter in Q3 2025 to $39 million.
- The company reduced Net Debt by about $60 million thus far in 2025.
- The EIA forecast for Q4 2025 Henry Hub natural gas was $3.33 per MMBtu.
Finance: draft a sensitivity analysis on W&T Offshore, Inc. (WTI) gas revenue if 2026 LNG export growth slows to 5% by next Tuesday.
W&T Offshore, Inc. (WTI) - Porter's Five Forces: Threat of new entrants
You're looking at the barriers to entry in the Gulf of Mexico (GOM) offshore space, and honestly, they are substantial. New players don't just waltz in and start drilling; the sheer scale of investment required keeps most smaller entities out.
High capital expenditure is required to enter the GOM offshore market.
Entering this arena demands massive upfront capital. Large-scale offshore projects typically require initial capital commitments that can swing from hundreds of millions to several billion dollars per development. Furthermore, the investment timeline is long; you're looking at 7-10 years from acquiring a lease to seeing that first barrel of oil or gas come ashore. This long lock-up period for capital is a major deterrent for potential new entrants.
For an established operator like W&T Offshore, Inc. (WTI), capital deployment is significant but focused on maintaining and enhancing existing assets. For instance, W&T Offshore's revised expectation for full-year 2025 capital expenditures (CapEx), excluding potential acquisitions, is set between $57 million and $63 million. Just in the third quarter of 2025, their accrual-based CapEx hit $22.5 million, driven by recompletion and facility work related to their 2024 Cox acquisition. This shows that even for an existing player, the ongoing capital need is in the tens of millions per quarter.
Entrants face significant regulatory and environmental compliance costs.
Regulatory compliance adds another layer of expense that new entrants must budget for. Consider the financial assurance requirements for decommissioning. The previous rule under the Biden administration was estimated to increase bonding requirements for offshore operators by an additional $6.9 billion, costing businesses an extra $665 million in annual premiums. While the Department of the Interior announced in May 2025 an intent to revise this rule to align with the 2020 framework-aiming to free up billions of dollars for producers-the underlying requirement for financial assurance for decommissioning obligations remains in place.
These compliance costs, even when potentially reduced, represent a significant, non-negotiable financial hurdle. New entrants must immediately factor in substantial costs for permitting, environmental reviews, and bonding before any physical work can begin. Here's a quick look at the scale of these compliance-related financial requirements:
| Cost Component / Metric | Estimated Financial Impact (Previous Rule) | W&T Offshore 2025 Full Year CapEx Guidance (Excl. Acquisitions) |
|---|---|---|
| Additional Bonding Requirement | $6.9 billion | N/A |
| Annual Premium Increase (Estimated) | $665 million | N/A |
| Total Expected 2025 CapEx | N/A | $57 million - $63 million |
| Q3 2025 Actual CapEx | N/A | $22.5 million |
W&T Offshore benefits from decades of existing, complex infrastructure and lease positions.
W&T Offshore, Inc. has built a formidable moat through time and asset accumulation. Tracy Krohn, the Chairman and CEO, has noted W&T Offshore has been an active operator in the GOM for over 40 years since its founding in 1983. This longevity translates directly into established physical and operational advantages.
W&T Offshore, Inc. currently holds working interests in 50 offshore fields in federal and state waters, with leases covering approximately 625,000 gross acres across the U.S. GOM. This existing footprint means new entrants must either compete for scarce, unleased acreage or attempt to acquire existing assets from incumbents, which often comes at a premium. Furthermore, W&T Offshore is actively investing in its own midstream assets, like pipelines planned in 2025, to lower future transportation costs, a benefit new entrants won't immediately possess. They are focused on leveraging this base:
- Holding interests in 50 offshore fields.
- Controlling approximately 625,000 gross acres leased.
- Investing in owned midstream infrastructure.
- Benefiting from decades of operational experience.
Bipartisan opposition to new drilling in areas like the Eastern GOM creates regulatory uncertainty for new leases.
Regulatory continuity is crucial for the long-term capital commitments offshore requires, but uncertainty definitely exists. For example, a Presidential ban announced on January 6, 2025, specifically targeted new offshore oil and gas drilling in certain areas, including the eastern Gulf of Mexico. While W&T Offshore, Inc. stated it had no impacted assets from that specific ban, the precedent of executive action creates risk for any new entrant planning long-term development in restricted zones.
The process for securing new acreage itself is layered and subject to review. The development of the 11th National OCS Program, which dictates future lease sales, involves multiple stages. The first analysis and proposal comment period for this program began on November 24, 2025, and is set to close on January 23, 2026. This multi-step, multi-year process means that even if a new entrant wins a bid, the path to production is subject to ongoing environmental review and public comment periods, which can cause significant delays and cost overruns. The regulatory environment, therefore, acts as a significant non-financial barrier.
Disclaimer
All information, articles, and product details provided on this website are for general informational and educational purposes only. We do not claim any ownership over, nor do we intend to infringe upon, any trademarks, copyrights, logos, brand names, or other intellectual property mentioned or depicted on this site. Such intellectual property remains the property of its respective owners, and any references here are made solely for identification or informational purposes, without implying any affiliation, endorsement, or partnership.
We make no representations or warranties, express or implied, regarding the accuracy, completeness, or suitability of any content or products presented. Nothing on this website should be construed as legal, tax, investment, financial, medical, or other professional advice. In addition, no part of this site—including articles or product references—constitutes a solicitation, recommendation, endorsement, advertisement, or offer to buy or sell any securities, franchises, or other financial instruments, particularly in jurisdictions where such activity would be unlawful.
All content is of a general nature and may not address the specific circumstances of any individual or entity. It is not a substitute for professional advice or services. Any actions you take based on the information provided here are strictly at your own risk. You accept full responsibility for any decisions or outcomes arising from your use of this website and agree to release us from any liability in connection with your use of, or reliance upon, the content or products found herein.