
|
Valoración DCF de X4 Pharmaceuticals, Inc. (XFOR) |
Completamente Editable: Adáptelo A Sus Necesidades En Excel O Sheets
Diseño Profesional: Plantillas Confiables Y Estándares De La Industria
Predeterminadas Para Un Uso Rápido Y Eficiente
Compatible con MAC / PC, completamente desbloqueado
No Se Necesita Experiencia; Fáciles De Seguir
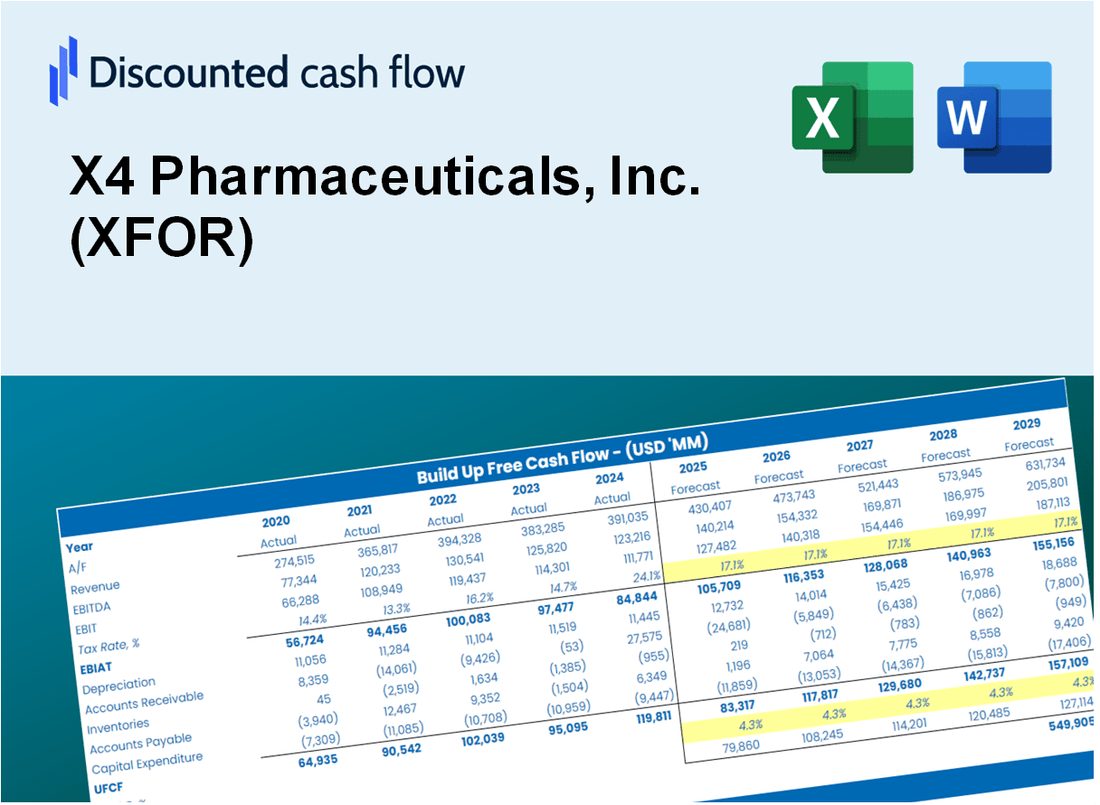
X4 Pharmaceuticals, Inc. (XFOR) Bundle
¡Explore las perspectivas financieras de X4 Pharmaceuticals, Inc. (XFOR) con nuestra calculadora DCF fácil de usar! Ingrese sus suposiciones con respecto al crecimiento, los márgenes y los gastos para calcular el valor intrínseco de X4 Pharmaceuticals, Inc. (XFOR) y refinar su estrategia de inversión.
Discounted Cash Flow (DCF) - (USD MM)
| Year | AY1 2020 |
AY2 2021 |
AY3 2022 |
AY4 2023 |
AY5 2024 |
FY1 2025 |
FY2 2026 |
FY3 2027 |
FY4 2028 |
FY5 2029 |
|---|---|---|---|---|---|---|---|---|---|---|
| Revenue | 3.0 | .0 | .0 | .0 | 2.6 | 1.9 | 1.4 | 1.1 | .8 | .6 |
| Revenue Growth, % | 0 | -100 | 0 | 0 | 0 | -25 | -25 | -25 | -25 | -25 |
| EBITDA | -58.1 | -84.5 | -87.6 | -107.1 | -27.6 | .4 | .3 | .2 | .2 | .1 |
| EBITDA, % | -1935.5 | 100 | 100 | 100 | -1078.45 | 20 | 20 | 20 | 20 | 20 |
| Depreciation | 1.2 | .5 | 2.0 | .4 | .8 | 1.4 | 1.1 | .8 | .6 | .5 |
| Depreciation, % | 41 | 100 | 100 | 100 | 31.13 | 74.43 | 74.43 | 74.43 | 74.43 | 74.43 |
| EBIT | -59.3 | -85.0 | -89.6 | -107.5 | -28.4 | .4 | .3 | .2 | .2 | .1 |
| EBIT, % | -1976.5 | 100 | 100 | 100 | -1109.58 | 20 | 20 | 20 | 20 | 20 |
| Total Cash | 78.7 | 81.8 | 121.7 | 114.2 | 102.1 | 1.9 | 1.4 | 1.1 | .8 | .6 |
| Total Cash, percent | .0 | .0 | .0 | .0 | .0 | .0 | .0 | .0 | .0 | .0 |
| Account Receivables | .9 | .7 | 1.2 | .6 | 1.7 | 1.5 | 1.1 | .9 | .6 | .5 |
| Account Receivables, % | 30.57 | 100 | 100 | 100 | 66.88 | 79.49 | 79.49 | 79.49 | 79.49 | 79.49 |
| Inventories | .0 | .0 | .0 | .0 | 2.8 | 1.5 | 1.2 | .9 | .6 | .5 |
| Inventories, % | 0 | 100 | 100 | 100 | 110.17 | 80 | 80 | 80 | 80 | 80 |
| Accounts Payable | 3.1 | 4.3 | 7.8 | 8.9 | 8.6 | 1.9 | 1.4 | 1.1 | .8 | .6 |
| Accounts Payable, % | 104.8 | 100 | 100 | 100 | 337.15 | 100 | 100 | 100 | 100 | 100 |
| Capital Expenditure | -1.4 | -.6 | -.1 | -.1 | -.3 | -.2 | -.2 | -.1 | -.1 | -.1 |
| Capital Expenditure, % | -45.4 | 100 | 100 | 100 | -12.75 | -11.63 | -11.63 | -11.63 | -11.63 | -11.63 |
| Tax Rate, % | -0.83468 | -0.83468 | -0.83468 | -0.83468 | -0.83468 | -0.83468 | -0.83468 | -0.83468 | -0.83468 | -0.83468 |
| EBITAT | -59.4 | -85.1 | -89.6 | -107.6 | -28.6 | .4 | .3 | .2 | .2 | .1 |
| Depreciation | ||||||||||
| Changes in Account Receivables | ||||||||||
| Changes in Inventories | ||||||||||
| Changes in Accounts Payable | ||||||||||
| Capital Expenditure | ||||||||||
| UFCF | -57.3 | -83.9 | -84.6 | -105.5 | -32.4 | -3.6 | 1.5 | 1.1 | .8 | .6 |
| WACC, % | 9.95 | 9.95 | 9.95 | 9.95 | 9.95 | 9.95 | 9.95 | 9.95 | 9.95 | 9.95 |
| PV UFCF | ||||||||||
| SUM PV UFCF | -.3 | |||||||||
| Long Term Growth Rate, % | 2.00 | |||||||||
| Free cash flow (T + 1) | 1 | |||||||||
| Terminal Value | 8 | |||||||||
| Present Terminal Value | 5 | |||||||||
| Enterprise Value | 5 | |||||||||
| Net Debt | 22 | |||||||||
| Equity Value | -18 | |||||||||
| Diluted Shares Outstanding, MM | 7 | |||||||||
| Equity Value Per Share | -2.64 |
What You Will Get
- Comprehensive XFOR Financials: Access to historical and projected data for precise valuation.
- Customizable Parameters: Adjust WACC, tax rates, revenue growth, and capital expenditures as needed.
- Real-Time Calculations: Intrinsic value and NPV are computed automatically.
- Scenario Analysis: Evaluate various scenarios to assess X4 Pharmaceuticals' future performance.
- User-Friendly Layout: Designed for professionals but easy for newcomers to navigate.
Key Features
- Customizable Drug Development Parameters: Adjust key metrics such as market potential, clinical trial costs, and projected timelines.
- Instant Valuation Models: Automatically generates intrinsic value, NPV, and other financial metrics in real-time.
- Industry-Leading Precision: Incorporates X4 Pharmaceuticals' actual performance data for accurate valuation results.
- Effortless Scenario Testing: Evaluate various hypotheses and analyze results with ease.
- Efficiency Booster: Avoid the hassle of constructing intricate valuation frameworks from the ground up.
How It Works
- Download: Obtain the comprehensive Excel file featuring X4 Pharmaceuticals, Inc.'s (XFOR) financial data.
- Customize: Modify forecasts such as revenue growth, EBITDA %, and WACC to fit your analysis.
- Update Automatically: Watch as intrinsic value and NPV calculations refresh in real-time.
- Test Scenarios: Generate various projections and instantly compare the results.
- Make Decisions: Leverage the valuation findings to inform your investment choices.
Why Choose X4 Pharmaceuticals, Inc. (XFOR)?
- Innovative Solutions: Cutting-edge therapies designed to address unmet medical needs.
- Proven Expertise: A team of seasoned professionals committed to advancing patient care.
- Robust Pipeline: A diverse range of drug candidates in various stages of development.
- Strong Partnerships: Collaborations with leading organizations to enhance research and development.
- Commitment to Quality: Adherence to the highest standards in pharmaceutical manufacturing and testing.
Who Should Use This Product?
- Individual Investors: Make informed decisions about buying or selling X4 Pharmaceuticals stock (XFOR).
- Financial Analysts: Streamline valuation processes with ready-to-use financial models specific to X4 Pharmaceuticals (XFOR).
- Consultants: Deliver professional valuation insights on X4 Pharmaceuticals (XFOR) to clients quickly and accurately.
- Business Owners: Understand how biopharmaceutical companies like X4 Pharmaceuticals (XFOR) are valued to guide your own strategy.
- Finance Students: Learn valuation techniques using real-world data and scenarios related to X4 Pharmaceuticals (XFOR).
What the Template Contains
- Preloaded XFOR Data: Historical and projected financial data, including revenue, EBIT, and capital expenditures.
- DCF and WACC Models: Professional-grade sheets for calculating intrinsic value and Weighted Average Cost of Capital.
- Editable Inputs: Yellow-highlighted cells for adjusting revenue growth, tax rates, and discount rates.
- Financial Statements: Comprehensive annual and quarterly financials for deeper analysis.
- Key Ratios: Profitability, leverage, and efficiency ratios to evaluate performance.
- Dashboard and Charts: Visual summaries of valuation outcomes and assumptions.
Disclaimer
All information, articles, and product details provided on this website are for general informational and educational purposes only. We do not claim any ownership over, nor do we intend to infringe upon, any trademarks, copyrights, logos, brand names, or other intellectual property mentioned or depicted on this site. Such intellectual property remains the property of its respective owners, and any references here are made solely for identification or informational purposes, without implying any affiliation, endorsement, or partnership.
We make no representations or warranties, express or implied, regarding the accuracy, completeness, or suitability of any content or products presented. Nothing on this website should be construed as legal, tax, investment, financial, medical, or other professional advice. In addition, no part of this site—including articles or product references—constitutes a solicitation, recommendation, endorsement, advertisement, or offer to buy or sell any securities, franchises, or other financial instruments, particularly in jurisdictions where such activity would be unlawful.
All content is of a general nature and may not address the specific circumstances of any individual or entity. It is not a substitute for professional advice or services. Any actions you take based on the information provided here are strictly at your own risk. You accept full responsibility for any decisions or outcomes arising from your use of this website and agree to release us from any liability in connection with your use of, or reliance upon, the content or products found herein.