
|
Valoración DCF de Xperi Inc. (XPER) |
Completamente Editable: Adáptelo A Sus Necesidades En Excel O Sheets
Diseño Profesional: Plantillas Confiables Y Estándares De La Industria
Predeterminadas Para Un Uso Rápido Y Eficiente
Compatible con MAC / PC, completamente desbloqueado
No Se Necesita Experiencia; Fáciles De Seguir
Xperi Inc. (XPER) Bundle
¡Explore el potencial financiero de Xperi Inc. (Xper) con nuestra calculadora DCF fácil de usar! Ingrese sus proyecciones para el crecimiento, los márgenes de ganancias y los gastos para calcular el valor intrínseco de Xperi Inc. (XPER) y refinar su enfoque de inversión.
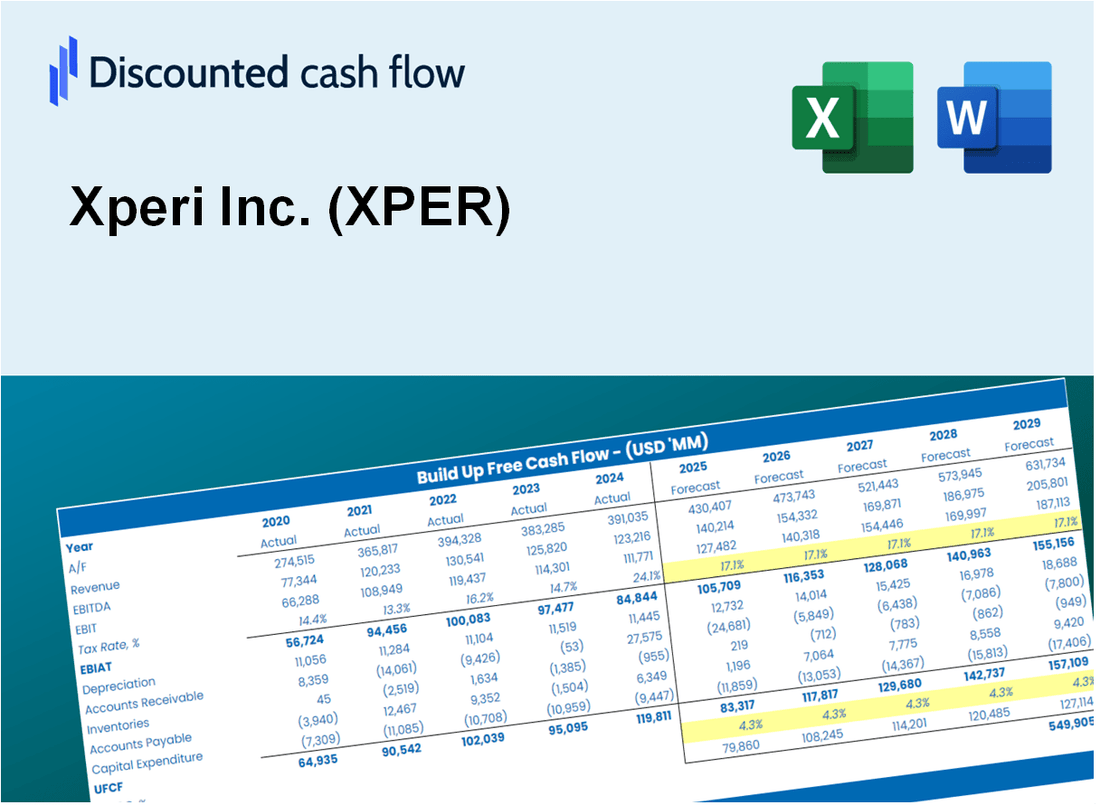
Discounted Cash Flow (DCF) - (USD MM)
| Year | AY1 2020 |
AY2 2021 |
AY3 2022 |
AY4 2023 |
AY5 2024 |
FY1 2025 |
FY2 2026 |
FY3 2027 |
FY4 2028 |
FY5 2029 |
|---|---|---|---|---|---|---|---|---|---|---|
| Revenue | 376.1 | 486.5 | 502.3 | 521.3 | 493.7 | 532.1 | 573.4 | 618.0 | 666.0 | 717.8 |
| Revenue Growth, % | 0 | 29.35 | 3.24 | 3.8 | -5.3 | 7.77 | 7.77 | 7.77 | 7.77 | 7.77 |
| EBITDA | -37.7 | -33.9 | -54.4 | -53.5 | 70.6 | -25.3 | -27.3 | -29.4 | -31.7 | -34.2 |
| EBITDA, % | -10.02 | -6.98 | -10.84 | -10.27 | 14.3 | -4.76 | -4.76 | -4.76 | -4.76 | -4.76 |
| Depreciation | 114.9 | 127.9 | 82.7 | 74.4 | 56.0 | 105.3 | 113.4 | 122.3 | 131.8 | 142.0 |
| Depreciation, % | 30.54 | 26.29 | 16.47 | 14.27 | 11.35 | 19.78 | 19.78 | 19.78 | 19.78 | 19.78 |
| EBIT | -152.6 | -161.8 | -137.2 | -127.9 | 14.6 | -130.6 | -140.7 | -151.7 | -163.5 | -176.2 |
| EBIT, % | -40.56 | -33.26 | -27.31 | -24.54 | 2.95 | -24.54 | -24.54 | -24.54 | -24.54 | -24.54 |
| Total Cash | 257.1 | 120.7 | 160.1 | 142.1 | 130.6 | 190.2 | 205.0 | 220.9 | 238.1 | 256.6 |
| Total Cash, percent | .0 | .0 | .0 | .0 | .0 | .0 | .0 | .0 | .0 | .0 |
| Account Receivables | 255.2 | 130.5 | 130.0 | 120.1 | 141.8 | 183.3 | 197.6 | 213.0 | 229.5 | 247.3 |
| Account Receivables, % | 67.85 | 26.82 | 25.88 | 23.04 | 28.73 | 34.46 | 34.46 | 34.46 | 34.46 | 34.46 |
| Inventories | 9.8 | 5.1 | 6.7 | 7.3 | 1.1 | 7.0 | 7.6 | 8.2 | 8.8 | 9.5 |
| Inventories, % | 2.61 | 1.05 | 1.33 | 1.4 | 0.21491 | 1.32 | 1.32 | 1.32 | 1.32 | 1.32 |
| Accounts Payable | 13.0 | 7.4 | 14.9 | 20.8 | 17.0 | 16.4 | 17.6 | 19.0 | 20.5 | 22.1 |
| Accounts Payable, % | 3.47 | 1.51 | 2.96 | 4 | 3.44 | 3.08 | 3.08 | 3.08 | 3.08 | 3.08 |
| Capital Expenditure | -7.0 | -9.1 | -14.4 | -12.9 | -17.0 | -13.3 | -14.4 | -15.5 | -16.7 | -18.0 |
| Capital Expenditure, % | -1.87 | -1.87 | -2.86 | -2.48 | -3.43 | -2.5 | -2.5 | -2.5 | -2.5 | -2.5 |
| Tax Rate, % | 220.98 | 220.98 | 220.98 | 220.98 | 220.98 | 220.98 | 220.98 | 220.98 | 220.98 | 220.98 |
| EBITAT | -139.7 | -177.4 | -139.6 | -134.8 | -17.6 | -102.3 | -110.2 | -118.8 | -128.0 | -138.0 |
| Depreciation | ||||||||||
| Changes in Account Receivables | ||||||||||
| Changes in Inventories | ||||||||||
| Changes in Accounts Payable | ||||||||||
| Capital Expenditure | ||||||||||
| UFCF | -283.8 | 65.2 | -64.9 | -58.1 | 2.0 | -58.4 | -24.7 | -26.6 | -28.6 | -30.9 |
| WACC, % | 5.93 | 5.99 | 5.99 | 5.99 | 5.19 | 5.82 | 5.82 | 5.82 | 5.82 | 5.82 |
| PV UFCF | ||||||||||
| SUM PV UFCF | -145.8 | |||||||||
| Long Term Growth Rate, % | 2.00 | |||||||||
| Free cash flow (T + 1) | -31 | |||||||||
| Terminal Value | -824 | |||||||||
| Present Terminal Value | -621 | |||||||||
| Enterprise Value | -767 | |||||||||
| Net Debt | -45 | |||||||||
| Equity Value | -722 | |||||||||
| Diluted Shares Outstanding, MM | 45 | |||||||||
| Equity Value Per Share | -16.01 |
What You Will Get
- Real Xperi Data: Preloaded financials – from revenue to EBIT – based on actual and projected figures for Xperi Inc. (XPER).
- Full Customization: Adjust all critical parameters (yellow cells) like WACC, growth %, and tax rates to fit your analysis of Xperi Inc. (XPER).
- Instant Valuation Updates: Automatic recalculations to analyze the impact of changes on Xperi Inc. (XPER)’s fair value.
- Versatile Excel Template: Tailored for quick edits, scenario testing, and detailed projections specific to Xperi Inc. (XPER).
- Time-Saving and Accurate: Skip building models from scratch while maintaining precision and flexibility in your evaluations of Xperi Inc. (XPER).
Key Features
- Comprehensive XPER Data: Pre-loaded with Xperi Inc.'s historical performance metrics and future projections.
- Customizable Financial Inputs: Modify revenue growth rates, profit margins, discount rates, tax assumptions, and capital investment plans.
- Interactive Valuation Model: Instant updates to Net Present Value (NPV) and intrinsic value based on user-defined parameters.
- Scenario Analysis: Develop various forecasting scenarios to evaluate different valuation possibilities.
- Intuitive User Interface: Clean, organized, and tailored for both industry experts and newcomers.
How It Works
- Download: Get the pre-built Excel file containing Xperi Inc.'s (XPER) financial data.
- Customize: Modify projections such as revenue growth, EBITDA %, and WACC to fit your analysis.
- Update Automatically: Watch as the intrinsic value and NPV calculations refresh in real-time.
- Test Scenarios: Generate various projections and evaluate results immediately.
- Make Decisions: Leverage the valuation insights to inform your investment choices.
Why Choose Xperi Inc. (XPER)?
- Save Time: Utilize our pre-built models to streamline your financial analysis.
- Enhance Accuracy: Dependable financial metrics and calculations minimize valuation errors.
- Completely Customizable: Adjust the model to align with your specific forecasts and assumptions.
- User-Friendly: Intuitive charts and outputs facilitate straightforward result interpretation.
- Endorsed by Professionals: Crafted for experts who prioritize precision and functionality.
Who Should Use This Product?
- Investors: Accurately estimate Xperi Inc.’s (XPER) fair value before making investment decisions.
- CFOs: Utilize a professional-grade DCF model for financial reporting and analysis specific to Xperi Inc. (XPER).
- Consultants: Easily modify the template for valuation reports tailored to Xperi Inc. (XPER) clients.
- Entrepreneurs: Discover insights into financial modeling practices of successful companies like Xperi Inc. (XPER).
- Educators: Employ it as a teaching resource to illustrate valuation methodologies relevant to Xperi Inc. (XPER).
What the Template Contains
- Pre-Filled DCF Model: Xperi Inc.’s (XPER) financial data preloaded for immediate use.
- WACC Calculator: Detailed calculations for Weighted Average Cost of Capital.
- Financial Ratios: Evaluate Xperi Inc.’s (XPER) profitability, leverage, and efficiency.
- Editable Inputs: Change assumptions such as growth, margins, and CAPEX to fit your scenarios.
- Financial Statements: Annual and quarterly reports to support detailed analysis.
- Interactive Dashboard: Easily visualize key valuation metrics and results.
Disclaimer
All information, articles, and product details provided on this website are for general informational and educational purposes only. We do not claim any ownership over, nor do we intend to infringe upon, any trademarks, copyrights, logos, brand names, or other intellectual property mentioned or depicted on this site. Such intellectual property remains the property of its respective owners, and any references here are made solely for identification or informational purposes, without implying any affiliation, endorsement, or partnership.
We make no representations or warranties, express or implied, regarding the accuracy, completeness, or suitability of any content or products presented. Nothing on this website should be construed as legal, tax, investment, financial, medical, or other professional advice. In addition, no part of this site—including articles or product references—constitutes a solicitation, recommendation, endorsement, advertisement, or offer to buy or sell any securities, franchises, or other financial instruments, particularly in jurisdictions where such activity would be unlawful.
All content is of a general nature and may not address the specific circumstances of any individual or entity. It is not a substitute for professional advice or services. Any actions you take based on the information provided here are strictly at your own risk. You accept full responsibility for any decisions or outcomes arising from your use of this website and agree to release us from any liability in connection with your use of, or reliance upon, the content or products found herein.