
|
Valoración DCF de Zen Technologies Limited (Zentec.NS) |
Completamente Editable: Adáptelo A Sus Necesidades En Excel O Sheets
Diseño Profesional: Plantillas Confiables Y Estándares De La Industria
Predeterminadas Para Un Uso Rápido Y Eficiente
Compatible con MAC / PC, completamente desbloqueado
No Se Necesita Experiencia; Fáciles De Seguir
Zen Technologies Limited (ZENTEC.NS) Bundle
¡Explore las perspectivas financieras de Zen Technologies Limited (Zentecns) con nuestra calculadora DCF fácil de usar! Ingrese sus suposiciones para el crecimiento, los márgenes y los costos para descubrir el valor intrínseco de Zen Technologies Limited (ZENTECNS) y mejorar su estrategia de inversión.
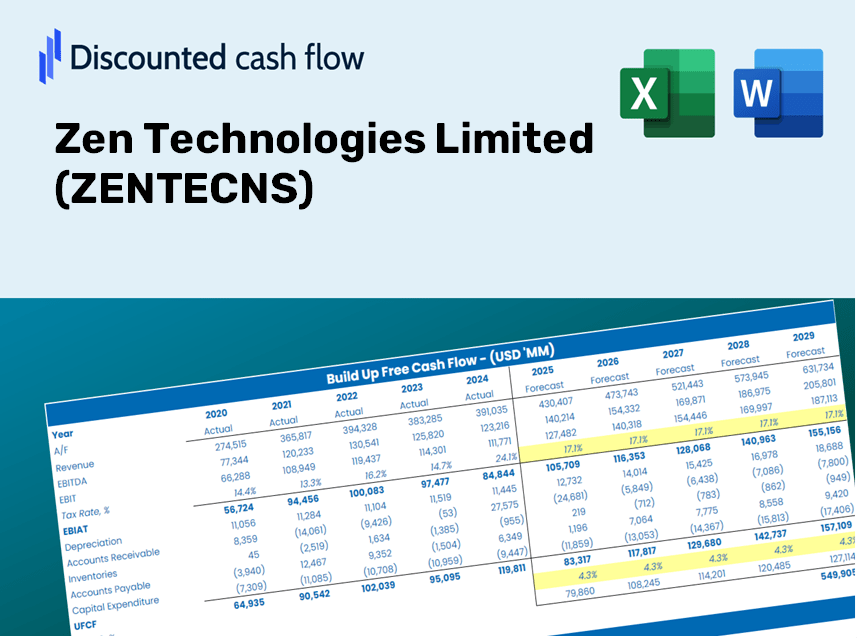
Discounted Cash Flow (DCF) - (USD MM)
| Year | AY1 2021 |
AY2 2022 |
AY3 2023 |
AY4 2024 |
AY5 2025 |
FY1 2026 |
FY2 2027 |
FY3 2028 |
FY4 2029 |
FY5 2030 |
|---|---|---|---|---|---|---|---|---|---|---|
| Revenue | 546.4 | 697.5 | 2,188.5 | 4,398.5 | 9,736.4 | 17,712.0 | 32,220.7 | 58,614.2 | 106,627.9 | 193,971.9 |
| Revenue Growth, % | 0 | 27.66 | 213.75 | 100.99 | 121.36 | 81.91 | 81.91 | 81.91 | 81.91 | 81.91 |
| EBITDA | 104.0 | 96.7 | 818.6 | 1,981.1 | 3,735.2 | 5,444.9 | 9,905.1 | 18,018.8 | 32,778.9 | 59,629.7 |
| EBITDA, % | 19.04 | 13.86 | 37.4 | 45.04 | 38.36 | 30.74 | 30.74 | 30.74 | 30.74 | 30.74 |
| Depreciation | 49.5 | 48.3 | 60.6 | 97.0 | 154.1 | 798.8 | 1,453.1 | 2,643.4 | 4,808.7 | 8,747.8 |
| Depreciation, % | 9.06 | 6.93 | 2.77 | 2.21 | 1.58 | 4.51 | 4.51 | 4.51 | 4.51 | 4.51 |
| EBIT | 54.5 | 48.3 | 758.0 | 1,884.1 | 3,581.1 | 4,646.1 | 8,452.0 | 15,375.4 | 27,970.2 | 50,881.9 |
| EBIT, % | 9.97 | 6.93 | 34.64 | 42.84 | 36.78 | 26.23 | 26.23 | 26.23 | 26.23 | 26.23 |
| Total Cash | 823.3 | 1,912.5 | 2,223.0 | 906.3 | 8,447.5 | 14,430.5 | 26,251.2 | 47,754.8 | 86,873.0 | 158,034.8 |
| Total Cash, percent | .0 | .0 | .0 | .0 | .0 | .0 | .0 | .0 | .0 | .0 |
| Account Receivables | 278.3 | 316.9 | 958.3 | 1,954.7 | 4,128.6 | 8,040.6 | 14,627.1 | 26,608.9 | 48,405.5 | 88,056.7 |
| Account Receivables, % | 50.92 | 45.43 | 43.79 | 44.44 | 42.4 | 45.4 | 45.4 | 45.4 | 45.4 | 45.4 |
| Inventories | 165.0 | 314.3 | 560.1 | 2,105.6 | 1,192.7 | 5,702.2 | 10,373.1 | 18,870.1 | 34,327.6 | 62,446.9 |
| Inventories, % | 30.2 | 45.06 | 25.59 | 47.87 | 12.25 | 32.19 | 32.19 | 32.19 | 32.19 | 32.19 |
| Accounts Payable | 31.9 | 39.3 | 67.3 | 321.0 | 254.7 | 867.0 | 1,577.2 | 2,869.2 | 5,219.5 | 9,495.0 |
| Accounts Payable, % | 5.85 | 5.64 | 3.08 | 7.3 | 2.62 | 4.9 | 4.9 | 4.9 | 4.9 | 4.9 |
| Capital Expenditure | -19.8 | -43.1 | -131.5 | -301.4 | -323.0 | -920.4 | -1,674.3 | -3,045.8 | -5,540.7 | -10,079.4 |
| Capital Expenditure, % | -3.63 | -6.17 | -6.01 | -6.85 | -3.32 | -5.2 | -5.2 | -5.2 | -5.2 | -5.2 |
| Tax Rate, % | 30.99 | 30.99 | 30.99 | 30.99 | 30.99 | 30.99 | 30.99 | 30.99 | 30.99 | 30.99 |
| EBITAT | 38.9 | 29.0 | 451.7 | 1,294.4 | 2,471.4 | 3,054.7 | 5,556.9 | 10,108.8 | 18,389.3 | 33,452.9 |
| Depreciation | ||||||||||
| Changes in Account Receivables | ||||||||||
| Changes in Inventories | ||||||||||
| Changes in Accounts Payable | ||||||||||
| Capital Expenditure | ||||||||||
| UFCF | -342.7 | -146.2 | -478.4 | -1,198.3 | 975.2 | -4,876.2 | -5,211.5 | -9,480.5 | -17,246.4 | -31,373.8 |
| WACC, % | 4.71 | 4.7 | 4.7 | 4.71 | 4.71 | 4.71 | 4.71 | 4.71 | 4.71 | 4.71 |
| PV UFCF | ||||||||||
| SUM PV UFCF | -56,941.0 | |||||||||
| Long Term Growth Rate, % | 4.00 | |||||||||
| Free cash flow (T + 1) | -32,629 | |||||||||
| Terminal Value | -4,602,293 | |||||||||
| Present Terminal Value | -3,656,410 | |||||||||
| Enterprise Value | -3,713,351 | |||||||||
| Net Debt | -8,881 | |||||||||
| Equity Value | -3,704,470 | |||||||||
| Diluted Shares Outstanding, MM | 87 | |||||||||
| Equity Value Per Share | -42,388.15 |
What You Will Receive
- Genuine Zen Data: Preloaded financials – covering everything from revenue to EBIT – based on actual and forecasted figures.
- Complete Customization: Modify all key parameters (yellow cells) such as WACC, growth %, and tax rates.
- Immediate Valuation Updates: Automatic recalculations to assess the effects of changes on Zen Technologies’ fair value.
- Flexible Excel Template: Designed for quick modifications, scenario analysis, and comprehensive projections.
- Efficient and Precise: Eliminate the need to build models from the ground up while ensuring accuracy and adaptability.
Key Features
- Comprehensive DCF Calculator: Offers detailed unlevered and levered DCF valuation models tailored for Zen Technologies Limited (ZENTECNS).
- WACC Calculator: Comes with a pre-configured Weighted Average Cost of Capital sheet that allows for customizable inputs.
- Modifiable Forecast Assumptions: Easily adjust growth rates, capital expenditures, and discount rates to suit your analysis.
- Integrated Financial Ratios: Evaluate profitability, leverage, and efficiency ratios specific to Zen Technologies Limited (ZENTECNS).
- Interactive Dashboard and Charts: Visualize key valuation metrics through graphical representations for straightforward interpretation.
How It Works
- 1. Access the Template: Download and open the Excel file containing Zen Technologies Limited's (ZENTECNS) preloaded data.
- 2. Adjust Assumptions: Modify essential inputs such as growth rates, WACC, and capital expenditures.
- 3. Instantaneous Results: The DCF model automatically computes intrinsic value and NPV.
- 4. Explore Scenarios: Analyze various forecasts to evaluate different valuation possibilities.
- 5. Present with Assurance: Showcase professional valuation insights to bolster your decision-making.
Why Choose the Zen Technologies Calculator?
- Designed for Experts: A specialized tool utilized by analysts, CFOs, and industry consultants.
- Accurate Financial Data: Historical and projected financials for Zen Technologies Limited (ZENTECNS) are preloaded for precision.
- Flexible Scenario Analysis: Effortlessly simulate various forecasts and assumptions.
- Comprehensive Outputs: Instantly computes intrinsic value, NPV, and other essential metrics.
- User-Friendly: Step-by-step guidance makes the process straightforward.
Who Should Consider Using Zen Technologies Limited (ZENTECNS)?
- Individual Investors: Gain insights to make informed decisions regarding the purchase or sale of Zen Technologies Limited (ZENTECNS) shares.
- Financial Analysts: Enhance valuation assessments with comprehensive financial models tailored for Zen Technologies Limited (ZENTECNS).
- Consultants: Provide clients with accurate and timely valuation analyses related to Zen Technologies Limited (ZENTECNS).
- Business Owners: Learn how tech companies like Zen Technologies Limited (ZENTECNS) are valued to inform your own business strategies.
- Finance Students: Explore practical valuation methods using real data and case studies from Zen Technologies Limited (ZENTECNS).
Contents of the Template
- Comprehensive DCF Model: A fully editable template featuring in-depth valuation calculations.
- Real-World Data: Zen Technologies Limited's (ZENTECNS) historical and projected financials included for analysis.
- Customizable Parameters: Modify WACC, growth rates, and tax assumptions to explore various scenarios.
- Financial Statements: Detailed annual and quarterly breakdowns for enhanced insights.
- Key Ratios: Integrated analysis for assessing profitability, efficiency, and leverage.
- Dashboard with Visual Outputs: Graphs and tables presenting clear, actionable results.
Disclaimer
All information, articles, and product details provided on this website are for general informational and educational purposes only. We do not claim any ownership over, nor do we intend to infringe upon, any trademarks, copyrights, logos, brand names, or other intellectual property mentioned or depicted on this site. Such intellectual property remains the property of its respective owners, and any references here are made solely for identification or informational purposes, without implying any affiliation, endorsement, or partnership.
We make no representations or warranties, express or implied, regarding the accuracy, completeness, or suitability of any content or products presented. Nothing on this website should be construed as legal, tax, investment, financial, medical, or other professional advice. In addition, no part of this site—including articles or product references—constitutes a solicitation, recommendation, endorsement, advertisement, or offer to buy or sell any securities, franchises, or other financial instruments, particularly in jurisdictions where such activity would be unlawful.
All content is of a general nature and may not address the specific circumstances of any individual or entity. It is not a substitute for professional advice or services. Any actions you take based on the information provided here are strictly at your own risk. You accept full responsibility for any decisions or outcomes arising from your use of this website and agree to release us from any liability in connection with your use of, or reliance upon, the content or products found herein.