
|
Valoración DCF de Zentek Ltd. (ZTEK) |
Completamente Editable: Adáptelo A Sus Necesidades En Excel O Sheets
Diseño Profesional: Plantillas Confiables Y Estándares De La Industria
Predeterminadas Para Un Uso Rápido Y Eficiente
Compatible con MAC / PC, completamente desbloqueado
No Se Necesita Experiencia; Fáciles De Seguir
Zentek Ltd. (ZTEK) Bundle
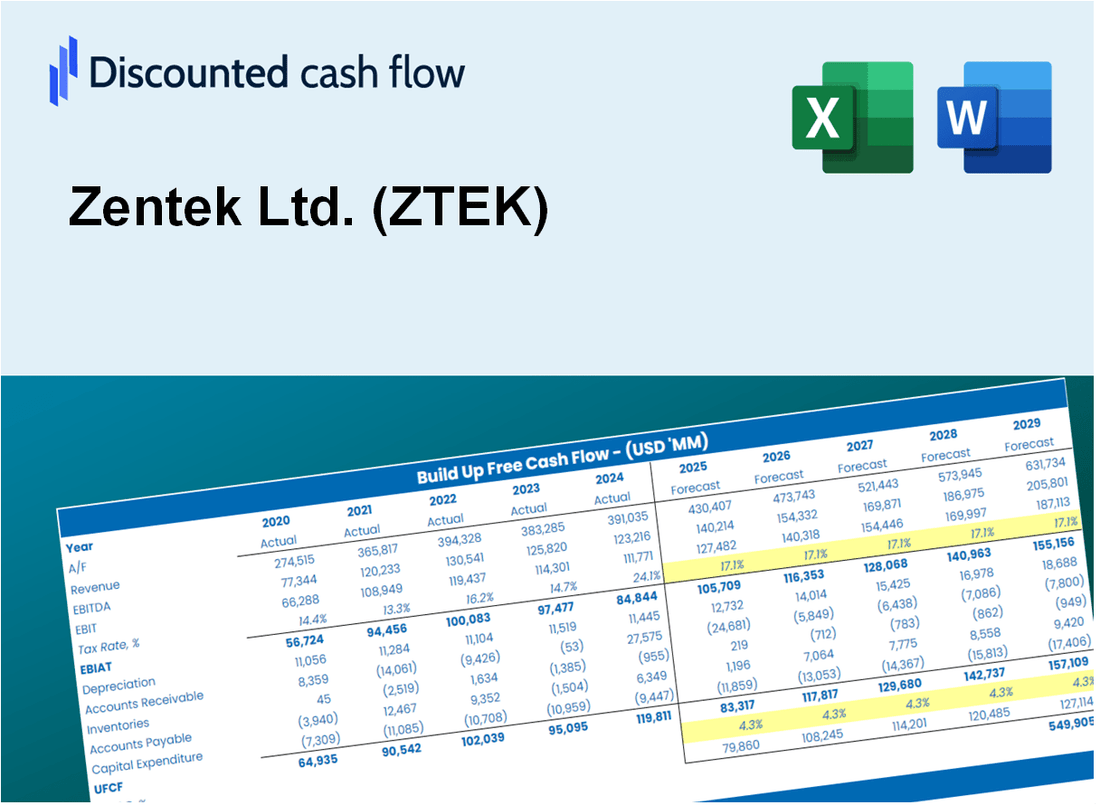
Ya sea que sea un inversor o analista, esta calculadora DCF (ZTEK) es su herramienta esencial para una valoración precisa. Precedido con datos reales de Zentek Ltd., puede ajustar los pronósticos y observar los efectos en tiempo real.
What You Will Get
- Comprehensive ZTEK Financials: Access to historical and projected data for precise valuation.
- Customizable Parameters: Adjust WACC, tax rates, revenue growth, and capital expenditures as needed.
- Dynamic Calculations: Intrinsic value and NPV are computed automatically.
- Scenario Analysis: Evaluate various scenarios to assess Zentek’s future performance.
- User-Friendly Interface: Designed for professionals while remaining approachable for newcomers.
Key Features
- Customizable Financial Inputs: Adjust essential metrics such as revenue projections, profit margins, and investment levels.
- Instant DCF Valuation: Quickly computes intrinsic value, net present value, and additional financial metrics.
- High-Precision Results: Leverages real-world financial data from Zentek Ltd. for accurate valuation assessments.
- Streamlined Scenario Analysis: Effortlessly explore various assumptions and evaluate their impacts.
- Efficiency Booster: Remove the hassle of creating intricate valuation models from the ground up.
How It Works
- Download: Get the pre-built Excel file containing Zentek Ltd.'s (ZTEK) financial data.
- Customize: Modify projections such as revenue growth, EBITDA %, and WACC to fit your analysis.
- Update Automatically: Watch the intrinsic value and NPV calculations refresh in real-time.
- Test Scenarios: Develop various forecasts and instantly evaluate different outcomes.
- Make Decisions: Leverage the valuation insights to inform your investment decisions.
Why Choose This Calculator for Zentek Ltd. (ZTEK)?
- All-in-One Solution: Combines DCF, WACC, and financial ratio analyses tailored for Zentek Ltd. (ZTEK).
- Flexible Inputs: Modify yellow-highlighted cells to explore different financial scenarios for Zentek Ltd. (ZTEK).
- In-Depth Analysis: Automatically computes the intrinsic value and Net Present Value for Zentek Ltd. (ZTEK).
- Integrated Data: Historical and projected data provide reliable benchmarks for analysis.
- High-Quality Standards: Perfect for financial analysts, investors, and consultants focusing on Zentek Ltd. (ZTEK).
Who Should Use This Product?
- Professional Investors: Develop comprehensive and reliable valuation models for analyzing Zentek Ltd. (ZTEK) investments.
- Corporate Finance Teams: Evaluate valuation scenarios to inform strategic decisions within the organization.
- Consultants and Advisors: Deliver precise valuation insights for clients considering Zentek Ltd. (ZTEK) stock.
- Students and Educators: Utilize real-world data to enhance understanding and teaching of financial modeling techniques.
- Tech Enthusiasts: Gain insights into how innovative companies like Zentek Ltd. (ZTEK) are valued in the marketplace.
What the Template Contains
- Pre-Filled DCF Model: Zentek Ltd.'s (ZTEK) financial data preloaded for immediate use.
- WACC Calculator: Detailed calculations for Weighted Average Cost of Capital.
- Financial Ratios: Evaluate Zentek Ltd.'s (ZTEK) profitability, leverage, and efficiency.
- Editable Inputs: Change assumptions such as growth, margins, and CAPEX to fit your scenarios.
- Financial Statements: Annual and quarterly reports to support detailed analysis.
- Interactive Dashboard: Easily visualize key valuation metrics and results.
Disclaimer
All information, articles, and product details provided on this website are for general informational and educational purposes only. We do not claim any ownership over, nor do we intend to infringe upon, any trademarks, copyrights, logos, brand names, or other intellectual property mentioned or depicted on this site. Such intellectual property remains the property of its respective owners, and any references here are made solely for identification or informational purposes, without implying any affiliation, endorsement, or partnership.
We make no representations or warranties, express or implied, regarding the accuracy, completeness, or suitability of any content or products presented. Nothing on this website should be construed as legal, tax, investment, financial, medical, or other professional advice. In addition, no part of this site—including articles or product references—constitutes a solicitation, recommendation, endorsement, advertisement, or offer to buy or sell any securities, franchises, or other financial instruments, particularly in jurisdictions where such activity would be unlawful.
All content is of a general nature and may not address the specific circumstances of any individual or entity. It is not a substitute for professional advice or services. Any actions you take based on the information provided here are strictly at your own risk. You accept full responsibility for any decisions or outcomes arising from your use of this website and agree to release us from any liability in connection with your use of, or reliance upon, the content or products found herein.