
|
Fawer Automotive Parts Limited Company (000030.SZ) Évaluation DCF |
Entièrement Modifiable: Adapté À Vos Besoins Dans Excel Ou Sheets
Conception Professionnelle: Modèles Fiables Et Conformes Aux Normes Du Secteur
Pré-Construits Pour Une Utilisation Rapide Et Efficace
Compatible MAC/PC, entièrement débloqué
Aucune Expertise N'Est Requise; Facile À Suivre
FAWER Automotive Parts Limited Company (000030.SZ) Bundle
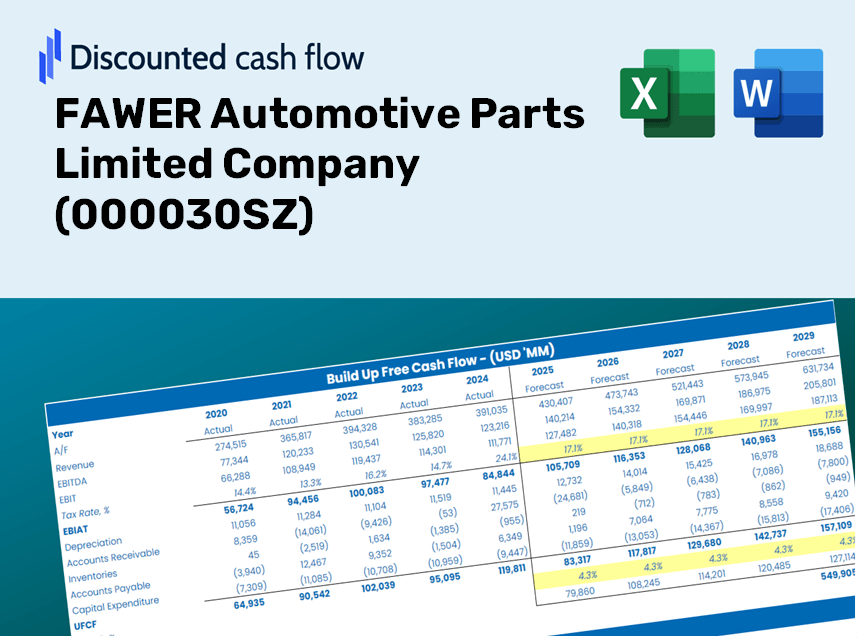
Évaluez les perspectives financières de Fawer Automotive Parts Limited Company comme un expert! Cette calculatrice DCF (000030SZ) vous fournit des finances pré-remplies et la flexibilité de modification de la croissance des revenus, du WACC, des marges et d'autres hypothèses cruciales pour s'aligner sur vos prévisions.
Discounted Cash Flow (DCF) - (USD MM)
| Year | AY1 2020 |
AY2 2021 |
AY3 2022 |
AY4 2023 |
AY5 2024 |
FY1 2025 |
FY2 2026 |
FY3 2027 |
FY4 2028 |
FY5 2029 |
|---|---|---|---|---|---|---|---|---|---|---|
| Revenue | 11,113.4 | 12,828.2 | 12,570.5 | 15,842.6 | 16,468.4 | 18,255.3 | 20,236.0 | 22,431.6 | 24,865.5 | 27,563.5 |
| Revenue Growth, % | 0 | 15.43 | -2.01 | 26.03 | 3.95 | 10.85 | 10.85 | 10.85 | 10.85 | 10.85 |
| EBITDA | 573.3 | 474.7 | 220.3 | 412.5 | 750.8 | 649.0 | 719.4 | 797.4 | 884.0 | 979.9 |
| EBITDA, % | 5.16 | 3.7 | 1.75 | 2.6 | 4.56 | 3.56 | 3.56 | 3.56 | 3.56 | 3.56 |
| Depreciation | 336.0 | 368.5 | 434.8 | 424.9 | 456.7 | 540.7 | 599.4 | 664.4 | 736.5 | 816.4 |
| Depreciation, % | 3.02 | 2.87 | 3.46 | 2.68 | 2.77 | 2.96 | 2.96 | 2.96 | 2.96 | 2.96 |
| EBIT | 237.3 | 106.2 | -214.5 | -12.3 | 294.1 | 108.3 | 120.0 | 133.0 | 147.5 | 163.5 |
| EBIT, % | 2.14 | 0.82794 | -1.71 | -0.07765427 | 1.79 | 0.593 | 0.593 | 0.593 | 0.593 | 0.593 |
| Total Cash | 1,813.3 | 2,855.5 | 2,491.6 | 2,179.6 | 2,334.7 | 3,152.0 | 3,494.0 | 3,873.1 | 4,293.4 | 4,759.2 |
| Total Cash, percent | .0 | .0 | .0 | .0 | .0 | .0 | .0 | .0 | .0 | .0 |
| Account Receivables | 4,320.6 | 3,144.0 | 3,062.6 | 4,701.9 | 5,465.0 | 5,498.9 | 6,095.6 | 6,757.0 | 7,490.1 | 8,302.8 |
| Account Receivables, % | 38.88 | 24.51 | 24.36 | 29.68 | 33.18 | 30.12 | 30.12 | 30.12 | 30.12 | 30.12 |
| Inventories | 1,040.9 | 1,142.5 | 1,338.7 | 1,244.1 | 1,310.6 | 1,633.2 | 1,810.4 | 2,006.9 | 2,224.6 | 2,466.0 |
| Inventories, % | 9.37 | 8.91 | 10.65 | 7.85 | 7.96 | 8.95 | 8.95 | 8.95 | 8.95 | 8.95 |
| Accounts Payable | 4,133.7 | 4,203.8 | 4,370.8 | 3,891.2 | 6,121.4 | 6,077.8 | 6,737.3 | 7,468.3 | 8,278.6 | 9,176.9 |
| Accounts Payable, % | 37.2 | 32.77 | 34.77 | 24.56 | 37.17 | 33.29 | 33.29 | 33.29 | 33.29 | 33.29 |
| Capital Expenditure | -629.7 | -629.8 | -571.6 | -515.7 | -434.1 | -767.3 | -850.5 | -942.8 | -1,045.1 | -1,158.5 |
| Capital Expenditure, % | -5.67 | -4.91 | -4.55 | -3.26 | -2.64 | -4.2 | -4.2 | -4.2 | -4.2 | -4.2 |
| Tax Rate, % | 28.02 | 28.02 | 28.02 | 28.02 | 28.02 | 28.02 | 28.02 | 28.02 | 28.02 | 28.02 |
| EBITAT | 230.4 | 105.6 | -234.9 | -10.4 | 211.7 | 98.0 | 108.7 | 120.4 | 133.5 | 148.0 |
| Depreciation | ||||||||||
| Changes in Account Receivables | ||||||||||
| Changes in Inventories | ||||||||||
| Changes in Accounts Payable | ||||||||||
| Capital Expenditure | ||||||||||
| UFCF | -1,291.1 | 989.5 | -319.6 | -2,125.4 | 1,634.9 | -528.6 | -256.9 | -284.7 | -315.6 | -349.9 |
| WACC, % | 6.09 | 6.1 | 6.1 | 6.04 | 6 | 6.07 | 6.07 | 6.07 | 6.07 | 6.07 |
| PV UFCF | ||||||||||
| SUM PV UFCF | -1,475.4 | |||||||||
| Long Term Growth Rate, % | 3.50 | |||||||||
| Free cash flow (T + 1) | -362 | |||||||||
| Terminal Value | -14,115 | |||||||||
| Present Terminal Value | -10,515 | |||||||||
| Enterprise Value | -11,991 | |||||||||
| Net Debt | -1,290 | |||||||||
| Equity Value | -10,700 | |||||||||
| Diluted Shares Outstanding, MM | 1,734 | |||||||||
| Equity Value Per Share | -6.17 |
Benefits of Choosing FAWER Automotive Parts Limited
- Authentic FAWER Financial Data: Pre-loaded with historical and projected financial metrics for thorough analysis.
- Completely Customizable Template: Easily adjust essential inputs such as revenue growth, WACC, and EBITDA percentage.
- Instant Calculations: Watch the intrinsic value of FAWER dynamically update based on your modifications.
- Expert Valuation Tool: Crafted for investors, analysts, and consultants aiming for precise DCF valuations.
- Intuitive Design: User-friendly layout and straightforward instructions suitable for all skill levels.
Key Features
- Authentic FAWER Financial Data: Gain access to precise historical records and future forecasts tailored for FAWER Automotive Parts Limited Company (000030SZ).
- Adjustable Forecast Parameters: Modify highlighted cells, such as WACC, growth rates, and profit margins, to align with your assumptions.
- Real-Time Calculations: Enjoy automatic updates for DCF, Net Present Value (NPV), and comprehensive cash flow assessments.
- User-Friendly Dashboard: Intuitive charts and summaries that help you easily interpret your valuation outcomes.
- Designed for All Experience Levels: An accessible and straightforward format catering to investors, CFOs, and consultants alike.
How It Functions
- Download: Obtain the prepared Excel file containing FAWER Automotive Parts Limited’s financial data.
- Customize: Modify forecasts such as revenue growth, EBITDA %, and WACC as needed.
- Update Automatically: The calculations for intrinsic value and NPV refresh in real time.
- Test Scenarios: Generate various projections and instantly compare the results.
- Make Decisions: Utilize the valuation findings to inform your investment approach.
Why Choose This Calculator?
- Designed for Industry Experts: A sophisticated tool tailored for auto industry analysts, financial officers, and consultants.
- Accurate Data Insights: Includes FAWER Automotive's historical and forecasted financials for precision.
- Flexible Scenario Analysis: Effortlessly test various projections and assumptions.
- Comprehensive Outputs: Instantly computes intrinsic value, NPV, and essential performance metrics.
- User-Friendly Interface: Step-by-step guidance ensures a smooth calculation experience.
Who Can Benefit from FAWER Automotive Parts Limited Company (000030SZ)?
- Professional Investors: Develop comprehensive and dependable valuation models for investment analysis.
- Corporate Finance Teams: Assess valuation scenarios to inform internal business strategies.
- Consultants and Advisors: Deliver precise valuation insights for clients interested in FAWER Automotive Parts (000030SZ).
- Students and Educators: Utilize real-world data for practical exercises and financial modeling coursework.
- Automotive Enthusiasts: Gain insights into how companies like FAWER are valued within the automotive sector.
Contents of the Template
- Preloaded FAWER Data: Historical and projected financial metrics, including revenue, EBIT, and capital expenditures.
- DCF and WACC Models: Advanced spreadsheets for determining intrinsic value and Weighted Average Cost of Capital.
- Editable Inputs: Yellow-highlighted cells for modifying revenue growth, tax rates, and discount rates.
- Financial Statements: Detailed annual and quarterly financial reports for in-depth analysis.
- Key Ratios: Ratios assessing profitability, leverage, and efficiency to gauge performance.
- Dashboard and Charts: Visual representations of valuation results and underlying assumptions.
Disclaimer
All information, articles, and product details provided on this website are for general informational and educational purposes only. We do not claim any ownership over, nor do we intend to infringe upon, any trademarks, copyrights, logos, brand names, or other intellectual property mentioned or depicted on this site. Such intellectual property remains the property of its respective owners, and any references here are made solely for identification or informational purposes, without implying any affiliation, endorsement, or partnership.
We make no representations or warranties, express or implied, regarding the accuracy, completeness, or suitability of any content or products presented. Nothing on this website should be construed as legal, tax, investment, financial, medical, or other professional advice. In addition, no part of this site—including articles or product references—constitutes a solicitation, recommendation, endorsement, advertisement, or offer to buy or sell any securities, franchises, or other financial instruments, particularly in jurisdictions where such activity would be unlawful.
All content is of a general nature and may not address the specific circumstances of any individual or entity. It is not a substitute for professional advice or services. Any actions you take based on the information provided here are strictly at your own risk. You accept full responsibility for any decisions or outcomes arising from your use of this website and agree to release us from any liability in connection with your use of, or reliance upon, the content or products found herein.