
|
Shenzhen Sed Industry Co., Ltd. (000032.SZ) Évaluation DCF |
Entièrement Modifiable: Adapté À Vos Besoins Dans Excel Ou Sheets
Conception Professionnelle: Modèles Fiables Et Conformes Aux Normes Du Secteur
Pré-Construits Pour Une Utilisation Rapide Et Efficace
Compatible MAC/PC, entièrement débloqué
Aucune Expertise N'Est Requise; Facile À Suivre
Shenzhen SED Industry Co., Ltd. (000032.SZ) Bundle
Améliorez vos stratégies d'investissement avec la calculatrice DCF DCF de Shenzhen Industry Co., Ltd. (000032SZ)! Explorez des données financières authentiques, ajustez les prévisions et les dépenses de croissance et observez les effets immédiats sur la valeur intrinsèque de Shenzhen Sed Industry Co., Ltd. (000032SZ) avec seulement quelques ajustements.
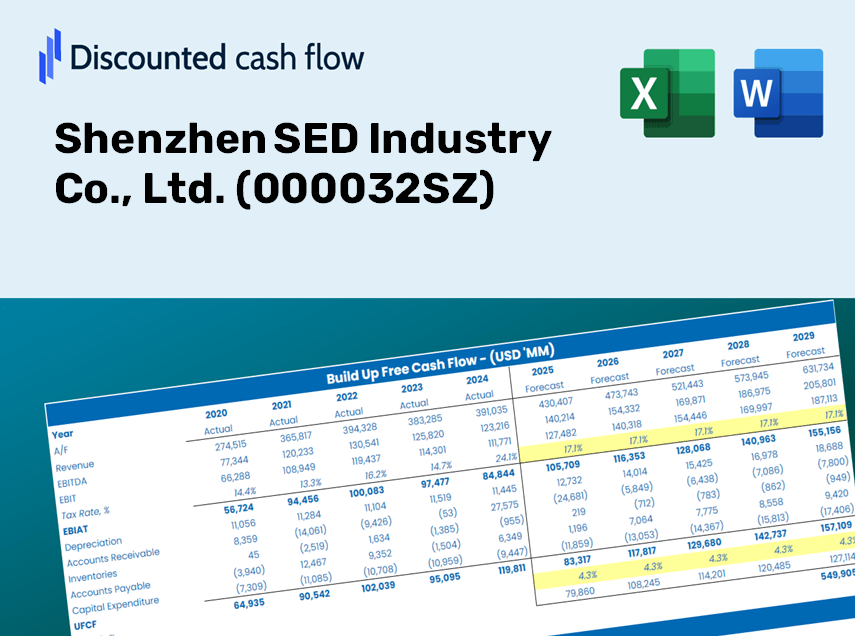
Discounted Cash Flow (DCF) - (USD MM)
| Year | AY1 2020 |
AY2 2021 |
AY3 2022 |
AY4 2023 |
AY5 2024 |
FY1 2025 |
FY2 2026 |
FY3 2027 |
FY4 2028 |
FY5 2029 |
|---|---|---|---|---|---|---|---|---|---|---|
| Revenue | 32,057.7 | 44,134.3 | 51,051.9 | 56,283.7 | 67,389.4 | 81,427.5 | 98,389.9 | 118,885.7 | 143,651.1 | 173,575.4 |
| Revenue Growth, % | 0 | 37.67 | 15.67 | 10.25 | 19.73 | 20.83 | 20.83 | 20.83 | 20.83 | 20.83 |
| EBITDA | 1,947.9 | 2,245.6 | 1,766.1 | 1,997.5 | 1,735.4 | 3,378.9 | 4,082.8 | 4,933.3 | 5,960.9 | 7,202.6 |
| EBITDA, % | 6.08 | 5.09 | 3.46 | 3.55 | 2.58 | 4.15 | 4.15 | 4.15 | 4.15 | 4.15 |
| Depreciation | 384.0 | 388.2 | 385.7 | 546.1 | 533.3 | 748.2 | 904.1 | 1,092.4 | 1,320.0 | 1,595.0 |
| Depreciation, % | 1.2 | 0.87952 | 0.75546 | 0.97027 | 0.79135 | 0.9189 | 0.9189 | 0.9189 | 0.9189 | 0.9189 |
| EBIT | 1,563.8 | 1,857.5 | 1,380.4 | 1,451.4 | 1,202.1 | 2,630.7 | 3,178.7 | 3,840.8 | 4,640.9 | 5,607.7 |
| EBIT, % | 4.88 | 4.21 | 2.7 | 2.58 | 1.78 | 3.23 | 3.23 | 3.23 | 3.23 | 3.23 |
| Total Cash | 909.8 | 7,885.1 | 9,616.9 | 10,153.2 | 12,252.8 | 12,338.4 | 14,908.7 | 18,014.3 | 21,766.9 | 26,301.3 |
| Total Cash, percent | .0 | .0 | .0 | .0 | .0 | .0 | .0 | .0 | .0 | .0 |
| Account Receivables | 19,058.7 | 23,957.3 | 28,438.3 | 29,948.5 | 43,324.0 | 46,729.2 | 56,463.5 | 68,225.5 | 82,437.8 | 99,610.6 |
| Account Receivables, % | 59.45 | 54.28 | 55.7 | 53.21 | 64.29 | 57.39 | 57.39 | 57.39 | 57.39 | 57.39 |
| Inventories | 79.8 | 989.7 | 1,123.9 | 923.5 | 1,077.1 | 1,291.8 | 1,560.9 | 1,886.0 | 2,278.9 | 2,753.6 |
| Inventories, % | 0.24884 | 2.24 | 2.2 | 1.64 | 1.6 | 1.59 | 1.59 | 1.59 | 1.59 | 1.59 |
| Accounts Payable | 10,836.0 | 19,215.4 | 23,590.5 | 19,296.2 | 38,598.6 | 35,031.6 | 42,329.1 | 51,146.8 | 61,801.4 | 74,675.3 |
| Accounts Payable, % | 33.8 | 43.54 | 46.21 | 34.28 | 57.28 | 43.02 | 43.02 | 43.02 | 43.02 | 43.02 |
| Capital Expenditure | -2.9 | -582.5 | -640.8 | -655.4 | -534.7 | -739.7 | -893.7 | -1,079.9 | -1,304.9 | -1,576.7 |
| Capital Expenditure, % | -0.00892165 | -1.32 | -1.26 | -1.16 | -0.7935 | -0.90837 | -0.90837 | -0.90837 | -0.90837 | -0.90837 |
| Tax Rate, % | 73.49 | 73.49 | 73.49 | 73.49 | 73.49 | 73.49 | 73.49 | 73.49 | 73.49 | 73.49 |
| EBITAT | 261.3 | 445.3 | -184.5 | 356.0 | 318.7 | 482.6 | 583.2 | 704.6 | 851.4 | 1,028.8 |
| Depreciation | ||||||||||
| Changes in Account Receivables | ||||||||||
| Changes in Inventories | ||||||||||
| Changes in Accounts Payable | ||||||||||
| Capital Expenditure | ||||||||||
| UFCF | -7,660.0 | 2,821.9 | -679.7 | -5,357.3 | 6,090.5 | -6,695.6 | -2,112.3 | -2,552.3 | -3,084.0 | -3,726.5 |
| WACC, % | 6.85 | 6.97 | 6.58 | 6.98 | 7.01 | 6.88 | 6.88 | 6.88 | 6.88 | 6.88 |
| PV UFCF | ||||||||||
| SUM PV UFCF | -15,239.3 | |||||||||
| Long Term Growth Rate, % | 2.00 | |||||||||
| Free cash flow (T + 1) | -3,801 | |||||||||
| Terminal Value | -77,882 | |||||||||
| Present Terminal Value | -55,840 | |||||||||
| Enterprise Value | -71,080 | |||||||||
| Net Debt | -3,778 | |||||||||
| Equity Value | -67,301 | |||||||||
| Diluted Shares Outstanding, MM | 1,138 | |||||||||
| Equity Value Per Share | -59.15 |
What You Will Receive
- Authentic 000032SZ Financial Data: Pre-populated with Shenzhen SED Industry’s historical and projected figures for accurate analysis.
- Completely Customizable Template: Easily adjust key variables such as revenue growth, WACC, and EBITDA percentage.
- Instantaneous Calculations: Watch as the intrinsic value of Shenzhen SED Industry updates in real-time with your modifications.
- Expert Valuation Tool: Tailored for investors, analysts, and consultants aiming for precise DCF outcomes.
- Intuitive Design: A straightforward layout with clear guidance suitable for users of all skill levels.
Key Features
- Real-Time SED Data: Filled with Shenzhen SED Industry Co., Ltd.'s (000032SZ) historical performance and future projections.
- Completely Customizable Inputs: Modify revenue growth, profit margins, discount rates, tax implications, and capital investments.
- Dynamic Valuation Framework: Automatic recalculations of Net Present Value (NPV) and intrinsic value based on your entered parameters.
- Scenario Analysis: Develop various forecasting scenarios to evaluate different valuation projections.
- User-Centric Interface: Intuitive, organized, and crafted for both seasoned professionals and newcomers.
How It Works
- Step 1: Download the Excel file for Shenzhen SED Industry Co., Ltd. (000032SZ).
- Step 2: Review the pre-filled financial data and projections for Shenzhen SED Industry Co., Ltd. (000032SZ).
- Step 3: Adjust key parameters such as revenue growth, WACC, and tax rates in the highlighted cells.
- Step 4: Observe the DCF model refresh in real-time as you modify your assumptions.
- Step 5: Examine the results and leverage them for your investment strategies.
Why Opt for This Calculator?
- User-Friendly and Intuitive: Perfect for both novices and seasoned experts.
- Customizable Inputs: Effortlessly adjust parameters to suit your analysis needs.
- Real-Time Updates: Observe immediate changes to Shenzhen SED Industry Co., Ltd.’s valuation as you modify the inputs.
- Pre-Configured: Comes loaded with Shenzhen SED Industry Co., Ltd.’s actual financial data for rapid assessments.
- Endorsed by Experts: Utilized by investors and analysts for making well-informed choices.
Who Is This Product Designed For?
- Professional Investors: Create comprehensive and accurate valuation models for analyzing portfolios related to Shenzhen SED Industry Co., Ltd. (000032SZ).
- Corporate Finance Teams: Evaluate various valuation scenarios to support strategic decision-making within the organization.
- Consultants and Advisors: Deliver precise valuation insights to clients regarding Shenzhen SED Industry Co., Ltd. (000032SZ) stock.
- Students and Educators: Utilize real-world financial data to enhance learning and teaching in financial modeling.
- Tech Enthusiasts: Gain insights into the market valuation of technology companies such as Shenzhen SED Industry Co., Ltd. (000032SZ).
What the Template Contains
- Operating and Balance Sheet Data: Pre-filled historical data and forecasts for Shenzhen SED Industry Co., Ltd. (000032SZ), including metrics such as revenue, EBITDA, EBIT, and capital expenditures.
- WACC Calculation: A specialized sheet for calculating the Weighted Average Cost of Capital (WACC), featuring parameters like Beta, risk-free rate, and share price.
- DCF Valuation (Unlevered and Levered): Customizable Discounted Cash Flow models that reveal intrinsic value through comprehensive calculations.
- Financial Statements: Pre-loaded annual and quarterly financial statements to facilitate thorough analysis.
- Key Ratios: Includes key financial ratios related to profitability, leverage, and efficiency for Shenzhen SED Industry Co., Ltd. (000032SZ).
- Dashboard and Charts: Visual representations of valuation outputs and assumptions for easy analysis of results.
Disclaimer
All information, articles, and product details provided on this website are for general informational and educational purposes only. We do not claim any ownership over, nor do we intend to infringe upon, any trademarks, copyrights, logos, brand names, or other intellectual property mentioned or depicted on this site. Such intellectual property remains the property of its respective owners, and any references here are made solely for identification or informational purposes, without implying any affiliation, endorsement, or partnership.
We make no representations or warranties, express or implied, regarding the accuracy, completeness, or suitability of any content or products presented. Nothing on this website should be construed as legal, tax, investment, financial, medical, or other professional advice. In addition, no part of this site—including articles or product references—constitutes a solicitation, recommendation, endorsement, advertisement, or offer to buy or sell any securities, franchises, or other financial instruments, particularly in jurisdictions where such activity would be unlawful.
All content is of a general nature and may not address the specific circumstances of any individual or entity. It is not a substitute for professional advice or services. Any actions you take based on the information provided here are strictly at your own risk. You accept full responsibility for any decisions or outcomes arising from your use of this website and agree to release us from any liability in connection with your use of, or reliance upon, the content or products found herein.