
|
Inner Mongolia Xingye Mining Co., Ltd. (000426.SZ) Valation DCF |
Entièrement Modifiable: Adapté À Vos Besoins Dans Excel Ou Sheets
Conception Professionnelle: Modèles Fiables Et Conformes Aux Normes Du Secteur
Pré-Construits Pour Une Utilisation Rapide Et Efficace
Compatible MAC/PC, entièrement débloqué
Aucune Expertise N'Est Requise; Facile À Suivre
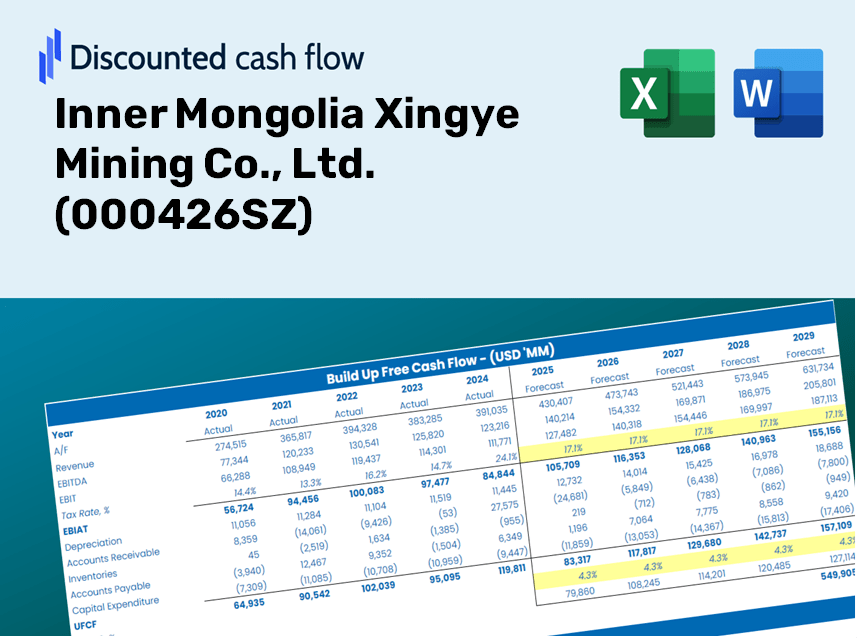
Inner Mongolia Xingye Mining Co., Ltd. (000426.SZ) Bundle
Vous cherchez à calculer la valeur intrinsèque de la Mongolie intérieure Xingye Mining Co., Ltd.? Notre calculatrice DCF (000426SZ) intègre des données réelles à des options de personnalisation complètes, vous permettant d'affiner vos prévisions et d'améliorer vos stratégies d'investissement.
Discounted Cash Flow (DCF) - (USD MM)
| Year | AY1 2020 |
AY2 2021 |
AY3 2022 |
AY4 2023 |
AY5 2024 |
FY1 2025 |
FY2 2026 |
FY3 2027 |
FY4 2028 |
FY5 2029 |
|---|---|---|---|---|---|---|---|---|---|---|
| Revenue | 940.2 | 2,008.8 | 2,085.9 | 3,706.0 | 4,270.4 | 6,370.7 | 9,504.1 | 14,178.7 | 21,152.3 | 31,555.9 |
| Revenue Growth, % | 0 | 113.65 | 3.84 | 77.67 | 15.23 | 49.18 | 49.18 | 49.18 | 49.18 | 49.18 |
| EBITDA | 415.8 | 836.0 | 792.4 | 1,823.0 | 2,496.0 | 2,949.2 | 4,399.8 | 6,563.8 | 9,792.1 | 14,608.3 |
| EBITDA, % | 44.22 | 41.62 | 37.99 | 49.19 | 58.45 | 46.29 | 46.29 | 46.29 | 46.29 | 46.29 |
| Depreciation | 307.4 | 300.9 | 338.3 | 483.8 | 537.7 | 1,140.9 | 1,702.0 | 2,539.1 | 3,788.0 | 5,651.1 |
| Depreciation, % | 32.7 | 14.98 | 16.22 | 13.05 | 12.59 | 17.91 | 17.91 | 17.91 | 17.91 | 17.91 |
| EBIT | 108.4 | 535.1 | 454.1 | 1,339.2 | 1,958.3 | 1,808.4 | 2,697.8 | 4,024.7 | 6,004.1 | 8,957.2 |
| EBIT, % | 11.53 | 26.64 | 21.77 | 36.14 | 45.86 | 28.39 | 28.39 | 28.39 | 28.39 | 28.39 |
| Total Cash | 134.0 | 135.9 | 293.8 | 339.5 | 1,138.8 | 903.8 | 1,348.3 | 2,011.4 | 3,000.7 | 4,476.5 |
| Total Cash, percent | .0 | .0 | .0 | .0 | .0 | .0 | .0 | .0 | .0 | .0 |
| Account Receivables | 120.5 | 48.3 | 46.2 | 296.2 | 51.8 | 339.3 | 506.2 | 755.2 | 1,126.7 | 1,680.8 |
| Account Receivables, % | 12.81 | 2.4 | 2.21 | 7.99 | 1.21 | 5.33 | 5.33 | 5.33 | 5.33 | 5.33 |
| Inventories | 409.4 | 324.4 | 413.3 | 276.4 | 506.1 | 1,259.1 | 1,878.4 | 2,802.3 | 4,180.5 | 6,236.7 |
| Inventories, % | 43.55 | 16.15 | 19.82 | 7.46 | 11.85 | 19.76 | 19.76 | 19.76 | 19.76 | 19.76 |
| Accounts Payable | 704.6 | 673.4 | 696.0 | 903.2 | 947.7 | 2,400.4 | 3,581.0 | 5,342.3 | 7,969.9 | 11,889.8 |
| Accounts Payable, % | 74.94 | 33.52 | 33.37 | 24.37 | 22.19 | 37.68 | 37.68 | 37.68 | 37.68 | 37.68 |
| Capital Expenditure | -343.4 | -369.6 | -469.0 | -657.8 | -663.2 | -1,410.3 | -2,104.0 | -3,138.8 | -4,682.6 | -6,985.7 |
| Capital Expenditure, % | -36.52 | -18.4 | -22.48 | -17.75 | -15.53 | -22.14 | -22.14 | -22.14 | -22.14 | -22.14 |
| Tax Rate, % | 13.33 | 13.33 | 13.33 | 13.33 | 13.33 | 13.33 | 13.33 | 13.33 | 13.33 | 13.33 |
| EBITAT | 99.6 | 369.9 | 433.0 | 1,211.2 | 1,697.2 | 1,567.8 | 2,338.9 | 3,489.3 | 5,205.4 | 7,765.6 |
| Depreciation | ||||||||||
| Changes in Account Receivables | ||||||||||
| Changes in Inventories | ||||||||||
| Changes in Accounts Payable | ||||||||||
| Capital Expenditure | ||||||||||
| UFCF | 238.3 | 427.2 | 238.1 | 1,131.3 | 1,630.9 | 1,710.4 | 2,331.4 | 3,478.0 | 5,188.7 | 7,740.7 |
| WACC, % | 7.71 | 7.66 | 7.71 | 7.7 | 7.69 | 7.69 | 7.69 | 7.69 | 7.69 | 7.69 |
| PV UFCF | ||||||||||
| SUM PV UFCF | 15,583.6 | |||||||||
| Long Term Growth Rate, % | 4.00 | |||||||||
| Free cash flow (T + 1) | 8,050 | |||||||||
| Terminal Value | 217,910 | |||||||||
| Present Terminal Value | 150,422 | |||||||||
| Enterprise Value | 166,006 | |||||||||
| Net Debt | -80 | |||||||||
| Equity Value | 166,086 | |||||||||
| Diluted Shares Outstanding, MM | 1,832 | |||||||||
| Equity Value Per Share | 90.65 |
What You Will Receive
- Authentic 000426SZ Financial Data: Pre-filled with Inner Mongolia Xingye Mining’s historical and forecast data for accurate analysis.
- Completely Customizable Template: Effortlessly adjust key inputs such as revenue growth, WACC, and EBITDA percentage.
- Instant Calculations: Watch the intrinsic value for Inner Mongolia Xingye Mining update immediately based on your modifications.
- Expert Valuation Tool: Tailored for investors, analysts, and consultants aiming for precise DCF outcomes.
- Intuitive Design: User-friendly layout and straightforward instructions suitable for all skill levels.
Key Features
- Customizable Forecast Inputs: Adjust essential metrics such as mineral production rates, operating costs, and capital investments.
- Instant DCF Valuation: Automatically computes intrinsic value, NPV, and other financial metrics in real-time.
- High-Precision Accuracy: Leverages Inner Mongolia Xingye Mining Co., Ltd.'s [000426SZ] actual financial data for accurate valuation results.
- Simplified Scenario Analysis: Easily evaluate various scenarios and compare their impacts effortlessly.
- Efficiency Booster: Streamlines the valuation process by removing the need to create intricate financial models from square one.
How It Functions
- Download the Template: Gain immediate access to the Excel-based (000426SZ) DCF Calculator.
- Input Your Assumptions: Modify the yellow-highlighted cells to reflect growth rates, WACC, margins, and other variables.
- Instant Calculations: The model automatically recalculates the intrinsic value of Inner Mongolia Xingye Mining Co., Ltd.
- Test Scenarios: Explore various assumptions to assess possible valuation changes.
- Analyze and Decide: Leverage the outcomes to inform your investment or financial strategies.
Why Opt for This Calculator?
- Designed for Experts: A sophisticated tool favored by analysts, CFOs, and industry consultants.
- Current Data: Inner Mongolia Xingye Mining Co., Ltd.'s historical and forecasted financials are preloaded for precision.
- Scenario Analysis: Effortlessly test various forecasts and assumptions.
- Transparent Results: Automatically computes intrinsic value, NPV, and essential metrics.
- User-Friendly: Step-by-step guidance to help you navigate the process easily.
Who Can Benefit from This Product?
- Investors: Evaluate the valuation of Inner Mongolia Xingye Mining Co., Ltd. (000426SZ) prior to making stock transactions.
- CFOs and Financial Analysts: Enhance valuation workflows and validate financial projections.
- Startup Founders: Discover how leading mining companies like Inner Mongolia Xingye Mining Co., Ltd. (000426SZ) are assessed in terms of value.
- Consultants: Provide detailed valuation reports tailored for your clients.
- Students and Educators: Utilize real-time data to learn and teach valuation methodologies.
What the Template Contains
- Operating and Balance Sheet Data: Pre-filled historical data and forecasts for Inner Mongolia Xingye Mining Co., Ltd. (000426SZ), including revenue, EBITDA, EBIT, and capital expenditures.
- WACC Calculation: A dedicated sheet for the Weighted Average Cost of Capital (WACC), featuring parameters such as Beta, risk-free rate, and share price.
- DCF Valuation (Unlevered and Levered): Customizable Discounted Cash Flow models that display intrinsic value with comprehensive calculations.
- Financial Statements: Pre-loaded annual and quarterly financial statements for Inner Mongolia Xingye Mining Co., Ltd. (000426SZ) to facilitate in-depth analysis.
- Key Ratios: A collection of profitability, leverage, and efficiency ratios relevant to Inner Mongolia Xingye Mining Co., Ltd. (000426SZ).
- Dashboard and Charts: A visual overview of valuation outputs and assumptions to easily analyze the results.
Disclaimer
All information, articles, and product details provided on this website are for general informational and educational purposes only. We do not claim any ownership over, nor do we intend to infringe upon, any trademarks, copyrights, logos, brand names, or other intellectual property mentioned or depicted on this site. Such intellectual property remains the property of its respective owners, and any references here are made solely for identification or informational purposes, without implying any affiliation, endorsement, or partnership.
We make no representations or warranties, express or implied, regarding the accuracy, completeness, or suitability of any content or products presented. Nothing on this website should be construed as legal, tax, investment, financial, medical, or other professional advice. In addition, no part of this site—including articles or product references—constitutes a solicitation, recommendation, endorsement, advertisement, or offer to buy or sell any securities, franchises, or other financial instruments, particularly in jurisdictions where such activity would be unlawful.
All content is of a general nature and may not address the specific circumstances of any individual or entity. It is not a substitute for professional advice or services. Any actions you take based on the information provided here are strictly at your own risk. You accept full responsibility for any decisions or outcomes arising from your use of this website and agree to release us from any liability in connection with your use of, or reliance upon, the content or products found herein.