
|
Gansu Jingyuan Coal Industry & Electricity Power Co., Ltd (000552.sz) Évaluation DCF |
Entièrement Modifiable: Adapté À Vos Besoins Dans Excel Ou Sheets
Conception Professionnelle: Modèles Fiables Et Conformes Aux Normes Du Secteur
Pré-Construits Pour Une Utilisation Rapide Et Efficace
Compatible MAC/PC, entièrement débloqué
Aucune Expertise N'Est Requise; Facile À Suivre
Gansu Jingyuan Coal Industry & Electricity Power Co., Ltd (000552.SZ) Bundle
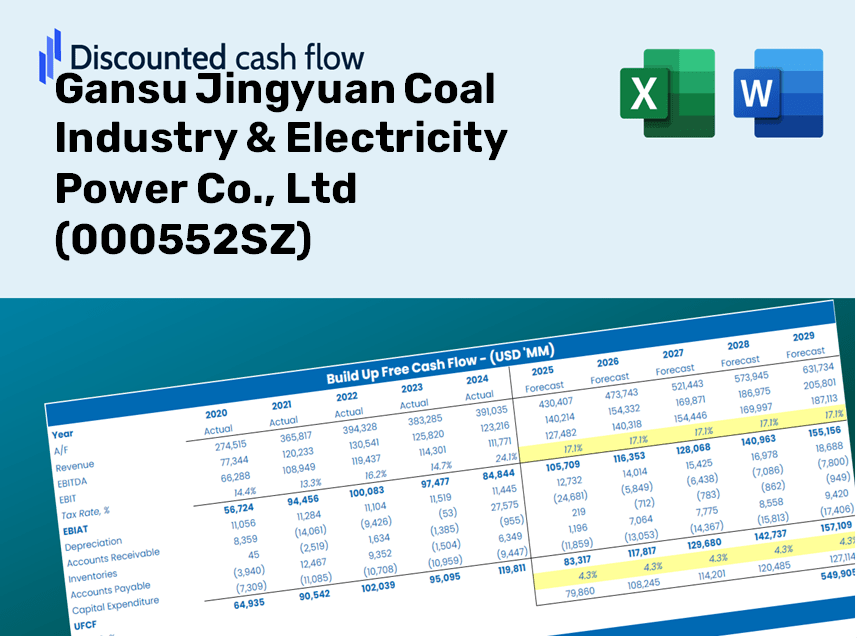
Évaluer l'industrie du charbon de Gansu Jingyuan & Electricity Power Co., Ltd's Financial Perspectives comme un expert! Ce calculatrice DCF (000552SZ) propose des finances pré-remplies ainsi que la flexibilité de modification de la croissance des revenus, du WACC, des marges et d'autres hypothèses essentielles pour s'aligner sur vos projections.
Discounted Cash Flow (DCF) - (USD MM)
| Year | AY1 2020 |
AY2 2021 |
AY3 2022 |
AY4 2023 |
AY5 2024 |
FY1 2025 |
FY2 2026 |
FY3 2027 |
FY4 2028 |
FY5 2029 |
|---|---|---|---|---|---|---|---|---|---|---|
| Revenue | 3,687.2 | 10,022.2 | 12,261.3 | 11,259.1 | 9,604.0 | 11,992.2 | 14,974.2 | 18,697.9 | 23,347.4 | 29,153.2 |
| Revenue Growth, % | 0 | 171.81 | 22.34 | -8.17 | -14.7 | 24.87 | 24.87 | 24.87 | 24.87 | 24.87 |
| EBITDA | 970.2 | 4,133.2 | 5,090.2 | 3,537.1 | 2,733.4 | 4,052.0 | 5,059.6 | 6,317.8 | 7,888.9 | 9,850.6 |
| EBITDA, % | 26.31 | 41.24 | 41.51 | 31.42 | 28.46 | 33.79 | 33.79 | 33.79 | 33.79 | 33.79 |
| Depreciation | 426.1 | 1,218.0 | 1,137.6 | 1,379.9 | 1,320.2 | 1,414.8 | 1,766.7 | 2,206.0 | 2,754.5 | 3,439.5 |
| Depreciation, % | 11.56 | 12.15 | 9.28 | 12.26 | 13.75 | 11.8 | 11.8 | 11.8 | 11.8 | 11.8 |
| EBIT | 544.1 | 2,915.2 | 3,952.5 | 2,157.3 | 1,413.1 | 2,637.2 | 3,293.0 | 4,111.8 | 5,134.3 | 6,411.1 |
| EBIT, % | 14.76 | 29.09 | 32.24 | 19.16 | 14.71 | 21.99 | 21.99 | 21.99 | 21.99 | 21.99 |
| Total Cash | 5,308.9 | 6,452.0 | 8,858.7 | 8,228.2 | 5,572.0 | 8,819.7 | 11,012.8 | 13,751.4 | 17,170.9 | 21,440.7 |
| Total Cash, percent | .0 | .0 | .0 | .0 | .0 | .0 | .0 | .0 | .0 | .0 |
| Account Receivables | 1,975.6 | 1,238.0 | 1,308.1 | 1,412.6 | 1,241.6 | 2,448.2 | 3,057.0 | 3,817.2 | 4,766.4 | 5,951.6 |
| Account Receivables, % | 53.58 | 12.35 | 10.67 | 12.55 | 12.93 | 20.42 | 20.42 | 20.42 | 20.42 | 20.42 |
| Inventories | 269.9 | 149.0 | 538.8 | 780.6 | 1,001.9 | 733.1 | 915.4 | 1,143.0 | 1,427.3 | 1,782.2 |
| Inventories, % | 7.32 | 1.49 | 4.39 | 6.93 | 10.43 | 6.11 | 6.11 | 6.11 | 6.11 | 6.11 |
| Accounts Payable | 649.7 | 3,001.8 | 3,188.3 | 3,957.4 | 4,517.6 | 3,735.9 | 4,664.8 | 5,824.8 | 7,273.3 | 9,081.9 |
| Accounts Payable, % | 17.62 | 29.95 | 26 | 35.15 | 47.04 | 31.15 | 31.15 | 31.15 | 31.15 | 31.15 |
| Capital Expenditure | -118.5 | -682.2 | -2,704.3 | -3,020.0 | -5,290.1 | -2,733.7 | -3,413.5 | -4,262.4 | -5,322.3 | -6,645.7 |
| Capital Expenditure, % | -3.21 | -6.81 | -22.06 | -26.82 | -55.08 | -22.8 | -22.8 | -22.8 | -22.8 | -22.8 |
| Tax Rate, % | 18.41 | 18.41 | 18.41 | 18.41 | 18.41 | 18.41 | 18.41 | 18.41 | 18.41 | 18.41 |
| EBITAT | 458.2 | 1,992.9 | 3,365.4 | 1,788.7 | 1,153.0 | 2,121.4 | 2,649.0 | 3,307.7 | 4,130.2 | 5,157.3 |
| Depreciation | ||||||||||
| Changes in Account Receivables | ||||||||||
| Changes in Inventories | ||||||||||
| Changes in Accounts Payable | ||||||||||
| Capital Expenditure | ||||||||||
| UFCF | -829.9 | 5,739.1 | 1,525.3 | 571.5 | -2,306.9 | -917.0 | 1,140.0 | 1,423.5 | 1,777.5 | 2,219.5 |
| WACC, % | 5.43 | 5.27 | 5.44 | 5.42 | 5.4 | 5.39 | 5.39 | 5.39 | 5.39 | 5.39 |
| PV UFCF | ||||||||||
| SUM PV UFCF | 4,520.0 | |||||||||
| Long Term Growth Rate, % | 0.50 | |||||||||
| Free cash flow (T + 1) | 2,231 | |||||||||
| Terminal Value | 45,604 | |||||||||
| Present Terminal Value | 35,074 | |||||||||
| Enterprise Value | 39,594 | |||||||||
| Net Debt | 1,591 | |||||||||
| Equity Value | 38,003 | |||||||||
| Diluted Shares Outstanding, MM | 6,072 | |||||||||
| Equity Value Per Share | 6.26 |
Benefits You Will Receive
- Customizable Excel Template: A fully adjustable Excel-based DCF Calculator featuring ready-made financials for Gansu Jingyuan Coal Industry & Electricity Power Co., Ltd (000552SZ).
- Accurate Data: Access to historical performance data and projections (highlighted in the yellow cells).
- Flexible Forecasting: Adjust key assumptions such as revenue growth, EBITDA percentage, and WACC.
- Instant Calculations: Quickly observe how your inputs affect the valuation of Gansu Jingyuan Coal Industry & Electricity Power Co., Ltd (000552SZ).
- Professional-Grade Tool: Designed specifically for investors, CFOs, consultants, and financial analysts.
- Intuitive Layout: Organized for simplicity and ease of navigation, complete with step-by-step guidance.
Key Features
- Pre-Loaded Data: Historical financial statements and pre-filled forecasts for Gansu Jingyuan Coal Industry & Electricity Power Co., Ltd (000552SZ).
- Fully Adjustable Inputs: Customize WACC, tax rates, revenue growth, and EBITDA margins as needed.
- Instant Results: View the intrinsic value of Gansu Jingyuan Coal Industry & Electricity Power Co., Ltd (000552SZ) recalculating in real time.
- Clear Visual Outputs: Dashboard charts illustrate valuation outcomes and essential metrics.
- Built for Accuracy: A professional-grade tool designed for analysts, investors, and finance specialists.
How It Operates
- Download the Template: Gain immediate access to the Excel-based Gansu Jingyuan Coal DCF Calculator.
- Input Your Assumptions: Modify the yellow-highlighted cells for growth rates, WACC, margins, and additional variables.
- Instant Calculations: The model will automatically refresh to reflect Gansu Jingyuan's intrinsic value.
- Test Scenarios: Explore various assumptions to assess potential changes in valuation.
- Analyze and Decide: Utilize the findings to inform your investment or financial strategies.
Why Choose the Gansu Jingyuan Coal Industry & Electricity Power Co., Ltd Calculator?
- Save Time: There's no need to build a DCF model from the ground up – it's readily available for immediate use.
- Enhance Accuracy: Dependable financial data and formulas help minimize valuation errors.
- Fully Customizable: Adjust the model to align with your specific assumptions and forecasts.
- Easy to Analyze: Intuitive charts and outputs simplify result interpretation.
- Preferred by Professionals: Developed for experts who prioritize precision and functionality.
Who Can Benefit from This Product?
- Investors: Assess Gansu Jingyuan Coal Industry & Electricity Power Co., Ltd's (000552SZ) valuation prior to making investment decisions.
- CFOs and Financial Analysts: Enhance valuation methodologies and evaluate financial forecasts for the company.
- Startup Founders: Understand the valuation strategies of established firms like Gansu Jingyuan Coal Industry & Electricity Power Co., Ltd (000552SZ).
- Consultants: Produce comprehensive valuation reports tailored to client needs.
- Students and Educators: Utilize actual data from Gansu Jingyuan Coal Industry & Electricity Power Co., Ltd (000552SZ) for hands-on learning and teaching valuation methods.
Contents of the Template
- Operating and Balance Sheet Data: Pre-filled historical data and forecasts for Gansu Jingyuan Coal Industry & Electricity Power Co., Ltd (000552SZ), including revenue, EBITDA, EBIT, and capital expenditures.
- WACC Calculation: A dedicated sheet for the Weighted Average Cost of Capital (WACC), featuring parameters such as Beta, risk-free rate, and share price.
- DCF Valuation (Unlevered and Levered): Customizable Discounted Cash Flow models that present intrinsic value with comprehensive calculations.
- Financial Statements: Pre-loaded annual and quarterly financial statements to facilitate in-depth analysis.
- Key Ratios: Includes profitability, leverage, and efficiency ratios specifically for Gansu Jingyuan Coal Industry & Electricity Power Co., Ltd (000552SZ).
- Dashboard and Charts: A visual summary of valuation outputs and assumptions to simplify result analysis.
Disclaimer
All information, articles, and product details provided on this website are for general informational and educational purposes only. We do not claim any ownership over, nor do we intend to infringe upon, any trademarks, copyrights, logos, brand names, or other intellectual property mentioned or depicted on this site. Such intellectual property remains the property of its respective owners, and any references here are made solely for identification or informational purposes, without implying any affiliation, endorsement, or partnership.
We make no representations or warranties, express or implied, regarding the accuracy, completeness, or suitability of any content or products presented. Nothing on this website should be construed as legal, tax, investment, financial, medical, or other professional advice. In addition, no part of this site—including articles or product references—constitutes a solicitation, recommendation, endorsement, advertisement, or offer to buy or sell any securities, franchises, or other financial instruments, particularly in jurisdictions where such activity would be unlawful.
All content is of a general nature and may not address the specific circumstances of any individual or entity. It is not a substitute for professional advice or services. Any actions you take based on the information provided here are strictly at your own risk. You accept full responsibility for any decisions or outcomes arising from your use of this website and agree to release us from any liability in connection with your use of, or reliance upon, the content or products found herein.