
|
Digital China Information Service Company Ltd. (000555.SZ) Évaluation DCF |
Entièrement Modifiable: Adapté À Vos Besoins Dans Excel Ou Sheets
Conception Professionnelle: Modèles Fiables Et Conformes Aux Normes Du Secteur
Pré-Construits Pour Une Utilisation Rapide Et Efficace
Compatible MAC/PC, entièrement débloqué
Aucune Expertise N'Est Requise; Facile À Suivre
Digital China Information Service Company Ltd. (000555.SZ) Bundle
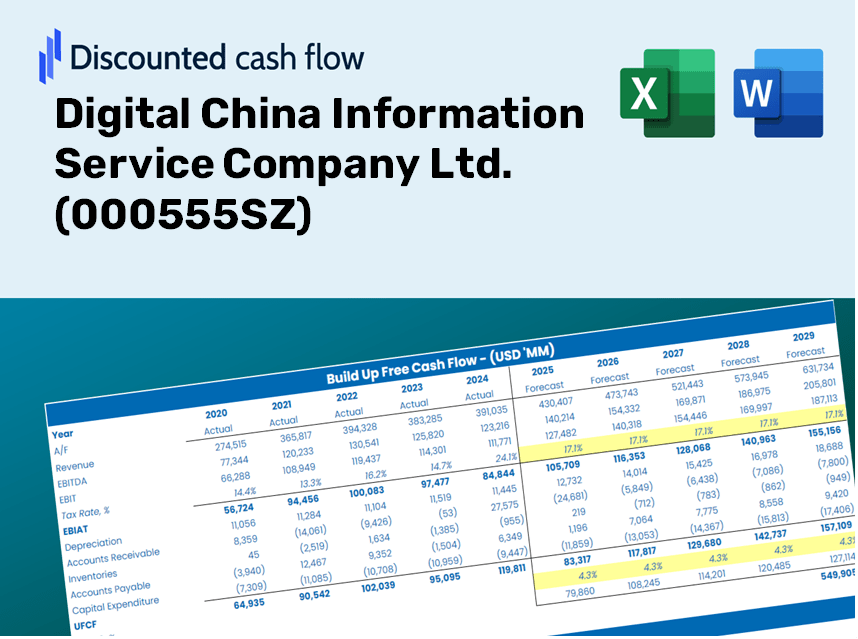
Évaluez les perspectives financières de Digital China Information Service Company Ltd. comme un expert! Ce calculatrice DCF (000555SZ) fournit des données financières pré-remplies ainsi que la flexibilité de modification de la croissance des revenus, du WACC, des marges et d'autres hypothèses essentielles pour s'aligner sur vos prévisions.
Discounted Cash Flow (DCF) - (USD MM)
| Year | AY1 2020 |
AY2 2021 |
AY3 2022 |
AY4 2023 |
AY5 2024 |
FY1 2025 |
FY2 2026 |
FY3 2027 |
FY4 2028 |
FY5 2029 |
|---|---|---|---|---|---|---|---|---|---|---|
| Revenue | 10,686.0 | 11,355.7 | 11,999.3 | 12,056.2 | 10,002.8 | 9,887.2 | 9,773.0 | 9,660.0 | 9,548.4 | 9,438.1 |
| Revenue Growth, % | 0 | 6.27 | 5.67 | 0.4748 | -17.03 | -1.16 | -1.16 | -1.16 | -1.16 | -1.16 |
| EBITDA | 425.8 | 471.1 | 316.8 | 419.6 | 18.7 | 285.6 | 282.3 | 279.0 | 275.8 | 272.6 |
| EBITDA, % | 3.98 | 4.15 | 2.64 | 3.48 | 0.1868 | 2.89 | 2.89 | 2.89 | 2.89 | 2.89 |
| Depreciation | 91.2 | 87.0 | 73.8 | 76.0 | 25.3 | 61.7 | 61.0 | 60.2 | 59.6 | 58.9 |
| Depreciation, % | 0.85383 | 0.76632 | 0.61503 | 0.63056 | 0.25269 | 0.62369 | 0.62369 | 0.62369 | 0.62369 | 0.62369 |
| EBIT | 334.5 | 384.1 | 243.0 | 343.6 | -6.6 | 223.9 | 221.3 | 218.8 | 216.2 | 213.7 |
| EBIT, % | 3.13 | 3.38 | 2.03 | 2.85 | -0.06588877 | 2.26 | 2.26 | 2.26 | 2.26 | 2.26 |
| Total Cash | 2,691.3 | 2,260.4 | 2,287.0 | 2,379.2 | 2,226.2 | 2,098.9 | 2,074.6 | 2,050.6 | 2,026.9 | 2,003.5 |
| Total Cash, percent | .0 | .0 | .0 | .0 | .0 | .0 | .0 | .0 | .0 | .0 |
| Account Receivables | 3,591.6 | 4,012.8 | 4,618.3 | 5,303.9 | 4,771.9 | 3,937.8 | 3,892.3 | 3,847.3 | 3,802.8 | 3,758.9 |
| Account Receivables, % | 33.61 | 35.34 | 38.49 | 43.99 | 47.71 | 39.83 | 39.83 | 39.83 | 39.83 | 39.83 |
| Inventories | 2,784.1 | 3,035.4 | 2,364.0 | 1,966.5 | 2,538.7 | 2,257.8 | 2,231.7 | 2,205.9 | 2,180.4 | 2,155.2 |
| Inventories, % | 26.05 | 26.73 | 19.7 | 16.31 | 25.38 | 22.84 | 22.84 | 22.84 | 22.84 | 22.84 |
| Accounts Payable | 2,925.1 | 3,515.6 | 3,520.6 | 3,819.7 | 3,833.1 | 3,117.9 | 3,081.9 | 3,046.3 | 3,011.1 | 2,976.3 |
| Accounts Payable, % | 27.37 | 30.96 | 29.34 | 31.68 | 38.32 | 31.53 | 31.53 | 31.53 | 31.53 | 31.53 |
| Capital Expenditure | -57.6 | -90.4 | -76.2 | -85.7 | -86.0 | -70.0 | -69.2 | -68.4 | -67.6 | -66.8 |
| Capital Expenditure, % | -0.53937 | -0.79571 | -0.63505 | -0.71094 | -0.85982 | -0.70818 | -0.70818 | -0.70818 | -0.70818 | -0.70818 |
| Tax Rate, % | -2.74 | -2.74 | -2.74 | -2.74 | -2.74 | -2.74 | -2.74 | -2.74 | -2.74 | -2.74 |
| EBITAT | 307.5 | 351.4 | 268.4 | 307.0 | -6.8 | 211.7 | 209.3 | 206.8 | 204.4 | 202.1 |
| Depreciation | ||||||||||
| Changes in Account Receivables | ||||||||||
| Changes in Inventories | ||||||||||
| Changes in Accounts Payable | ||||||||||
| Capital Expenditure | ||||||||||
| UFCF | -3,109.5 | 266.2 | 336.8 | 308.2 | -94.3 | 603.2 | 236.6 | 233.8 | 231.1 | 228.5 |
| WACC, % | 4.86 | 4.86 | 4.89 | 4.85 | 4.89 | 4.87 | 4.87 | 4.87 | 4.87 | 4.87 |
| PV UFCF | ||||||||||
| SUM PV UFCF | 1,364.4 | |||||||||
| Long Term Growth Rate, % | 3.00 | |||||||||
| Free cash flow (T + 1) | 235 | |||||||||
| Terminal Value | 12,609 | |||||||||
| Present Terminal Value | 9,943 | |||||||||
| Enterprise Value | 11,307 | |||||||||
| Net Debt | -1,613 | |||||||||
| Equity Value | 12,920 | |||||||||
| Diluted Shares Outstanding, MM | 962 | |||||||||
| Equity Value Per Share | 13.42 |
Your Benefits
- Customizable Excel Template: An easy-to-edit Excel-based DCF Calculator featuring pre-populated financial data for Digital China Information Service Company Ltd. (000555SZ).
- Real-Time Data: Access to historical performance metrics and forward-looking projections (highlighted in the yellow cells).
- Forecast Customization: Adjust key assumptions such as revenue growth rates, EBITDA percentages, and WACC as needed.
- Instant Calculations: Quickly observe how your adjustments affect the valuation of Digital China Information Service Company Ltd. (000555SZ).
- Professional-Grade Tool: Designed for investors, CFOs, consultants, and financial analysts to utilize.
- Intuitive Layout: Arranged for ease of navigation and understanding, complete with step-by-step guidance.
Key Features
- Pre-Loaded Data: Historical financial statements and pre-filled forecasts for Digital China Information Service Company Ltd. (000555SZ).
- Fully Adjustable Inputs: Modify parameters like WACC, tax rates, revenue growth, and EBITDA margins as needed.
- Instant Results: View the intrinsic value of Digital China Information Service Company Ltd. (000555SZ) recalculating in real time.
- Clear Visual Outputs: Dashboard charts present valuation results and key performance metrics clearly.
- Built for Accuracy: A reliable tool designed for analysts, investors, and financial professionals.
How It Works
- Step 1: Download the prebuilt Excel template featuring Digital China Information Service Company Ltd.'s (000555SZ) data.
- Step 2: Review the pre-filled sheets to grasp the essential metrics.
- Step 3: Modify forecasts and assumptions in the editable yellow cells (WACC, growth, margins).
- Step 4: Instantly access recalculated results, including the intrinsic value of Digital China Information Service Company Ltd. (000555SZ).
- Step 5: Use the outputs to make informed investment choices or generate detailed reports.
Why Opt for This Calculator?
- Precise Information: Up-to-date financial data for Digital China Information Service Company Ltd. (000555SZ) ensures trustworthy valuation outcomes.
- Tailorable: Modify essential variables such as growth rates, WACC, and tax rates to align with your specific forecasts.
- Efficiency Boost: Pre-configured calculations save you the effort of building from the ground up.
- Expert-Quality Tool: Crafted for investors, analysts, and consultants in the field.
- User-Friendly Interface: An intuitive design and comprehensive guidelines make it accessible for all users.
Who Should Use This Product?
- Professional Investors: Develop comprehensive and trustworthy valuation models for analyzing portfolios related to Digital China Information Service Company Ltd. (000555SZ).
- Corporate Finance Teams: Evaluate valuation scenarios to inform and shape internal strategic initiatives.
- Consultants and Advisors: Deliver precise valuation insights regarding Digital China Information Service Company Ltd. (000555SZ) to clients.
- Students and Educators: Utilize real-world data to enhance learning and practice of financial modeling techniques.
- Tech Enthusiasts: Gain insights into the market valuation of tech firms like Digital China Information Service Company Ltd. (000555SZ).
Contents of the Template
- Comprehensive DCF Model: An editable template featuring detailed valuation calculations.
- Real-World Data: Digital China Information Service Company Ltd.'s (000555SZ) historical and projected financials preloaded for analysis.
- Customizable Parameters: Modify WACC, growth rates, and tax assumptions to explore various scenarios.
- Financial Statements: Complete annual and quarterly breakdowns for in-depth insights.
- Key Ratios: Integrated analysis for profitability, efficiency, and leverage metrics.
- Dashboard with Visual Outputs: Charts and tables that provide clear, actionable insights.
Disclaimer
All information, articles, and product details provided on this website are for general informational and educational purposes only. We do not claim any ownership over, nor do we intend to infringe upon, any trademarks, copyrights, logos, brand names, or other intellectual property mentioned or depicted on this site. Such intellectual property remains the property of its respective owners, and any references here are made solely for identification or informational purposes, without implying any affiliation, endorsement, or partnership.
We make no representations or warranties, express or implied, regarding the accuracy, completeness, or suitability of any content or products presented. Nothing on this website should be construed as legal, tax, investment, financial, medical, or other professional advice. In addition, no part of this site—including articles or product references—constitutes a solicitation, recommendation, endorsement, advertisement, or offer to buy or sell any securities, franchises, or other financial instruments, particularly in jurisdictions where such activity would be unlawful.
All content is of a general nature and may not address the specific circumstances of any individual or entity. It is not a substitute for professional advice or services. Any actions you take based on the information provided here are strictly at your own risk. You accept full responsibility for any decisions or outcomes arising from your use of this website and agree to release us from any liability in connection with your use of, or reliance upon, the content or products found herein.