
|
5I5J Holding Group Co., Ltd. (000560.SZ) Valeure DCF |
Entièrement Modifiable: Adapté À Vos Besoins Dans Excel Ou Sheets
Conception Professionnelle: Modèles Fiables Et Conformes Aux Normes Du Secteur
Pré-Construits Pour Une Utilisation Rapide Et Efficace
Compatible MAC/PC, entièrement débloqué
Aucune Expertise N'Est Requise; Facile À Suivre
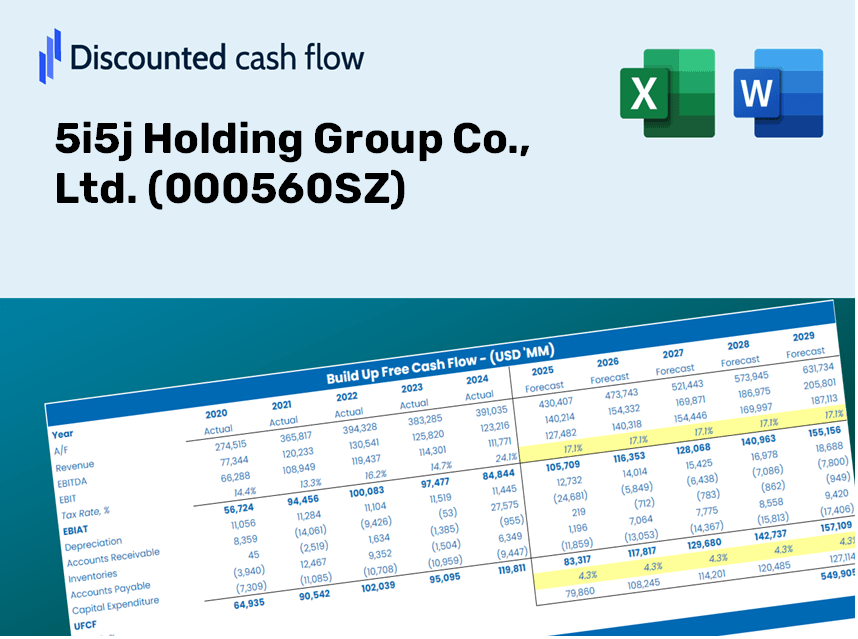
5i5j Holding Group Co., Ltd. (000560.SZ) Bundle
Explorez l'avenir financier de 5I5J Holding Group Co., Ltd. (000560SZ) avec notre calculatrice DCF conviviale! Entrez vos projections pour la croissance, les marges et les dépenses pour découvrir la valeur intrinsèque de 5I5J Holding Group Co., Ltd. (000560SZ) et affinez votre approche d'investissement.
Discounted Cash Flow (DCF) - (USD MM)
| Year | AY1 2020 |
AY2 2021 |
AY3 2022 |
AY4 2023 |
AY5 2024 |
FY1 2025 |
FY2 2026 |
FY3 2027 |
FY4 2028 |
FY5 2029 |
|---|---|---|---|---|---|---|---|---|---|---|
| Revenue | 9,574.9 | 11,962.9 | 11,673.4 | 12,091.7 | 12,536.1 | 13,469.3 | 14,472.1 | 15,549.5 | 16,707.0 | 17,950.8 |
| Revenue Growth, % | 0 | 24.94 | -2.42 | 3.58 | 3.67 | 7.44 | 7.44 | 7.44 | 7.44 | 7.44 |
| EBITDA | 808.4 | -135.1 | -596.0 | -888.5 | -514.6 | -249.1 | -267.6 | -287.5 | -308.9 | -331.9 |
| EBITDA, % | 8.44 | -1.13 | -5.11 | -7.35 | -4.11 | -1.85 | -1.85 | -1.85 | -1.85 | -1.85 |
| Depreciation | 128.5 | 123.4 | 98.8 | 91.9 | 62.1 | 120.6 | 129.5 | 139.2 | 149.5 | 160.7 |
| Depreciation, % | 1.34 | 1.03 | 0.84667 | 0.75993 | 0.495 | 0.895 | 0.895 | 0.895 | 0.895 | 0.895 |
| EBIT | 679.9 | -258.6 | -694.8 | -980.4 | -576.7 | -369.6 | -397.1 | -426.7 | -458.4 | -492.6 |
| EBIT, % | 7.1 | -2.16 | -5.95 | -8.11 | -4.6 | -2.74 | -2.74 | -2.74 | -2.74 | -2.74 |
| Total Cash | 5,069.3 | 4,764.8 | 4,210.9 | 3,898.5 | 3,554.6 | 5,103.3 | 5,483.3 | 5,891.5 | 6,330.0 | 6,801.3 |
| Total Cash, percent | .0 | .0 | .0 | .0 | .0 | .0 | .0 | .0 | .0 | .0 |
| Account Receivables | 1,340.2 | 3,997.4 | 4,614.8 | 4,490.1 | 1,622.5 | 3,691.2 | 3,965.9 | 4,261.2 | 4,578.4 | 4,919.3 |
| Account Receivables, % | 14 | 33.42 | 39.53 | 37.13 | 12.94 | 27.4 | 27.4 | 27.4 | 27.4 | 27.4 |
| Inventories | 488.5 | 620.3 | 509.4 | 455.7 | 216.5 | 542.7 | 583.1 | 626.5 | 673.2 | 723.3 |
| Inventories, % | 5.1 | 5.19 | 4.36 | 3.77 | 1.73 | 4.03 | 4.03 | 4.03 | 4.03 | 4.03 |
| Accounts Payable | 426.7 | 554.5 | 463.5 | 404.9 | 392.5 | 526.4 | 565.6 | 607.7 | 653.0 | 701.6 |
| Accounts Payable, % | 4.46 | 4.64 | 3.97 | 3.35 | 3.13 | 3.91 | 3.91 | 3.91 | 3.91 | 3.91 |
| Capital Expenditure | -652.5 | -832.5 | -306.4 | -284.3 | -386.2 | -588.1 | -631.9 | -678.9 | -729.4 | -783.7 |
| Capital Expenditure, % | -6.81 | -6.96 | -2.62 | -2.35 | -3.08 | -4.37 | -4.37 | -4.37 | -4.37 | -4.37 |
| Tax Rate, % | 41.37 | 41.37 | 41.37 | 41.37 | 41.37 | 41.37 | 41.37 | 41.37 | 41.37 | 41.37 |
| EBITAT | 438.9 | -185.5 | -770.1 | -971.5 | -338.1 | -291.3 | -312.9 | -336.2 | -361.3 | -388.2 |
| Depreciation | ||||||||||
| Changes in Account Receivables | ||||||||||
| Changes in Inventories | ||||||||||
| Changes in Accounts Payable | ||||||||||
| Capital Expenditure | ||||||||||
| UFCF | -1,487.0 | -3,556.0 | -1,575.1 | -1,044.0 | 2,432.0 | -3,019.7 | -1,091.3 | -1,172.5 | -1,259.8 | -1,353.6 |
| WACC, % | 8.08 | 8.56 | 10.45 | 10.39 | 7.69 | 9.03 | 9.03 | 9.03 | 9.03 | 9.03 |
| PV UFCF | ||||||||||
| SUM PV UFCF | -6,361.6 | |||||||||
| Long Term Growth Rate, % | 2.80 | |||||||||
| Free cash flow (T + 1) | -1,391 | |||||||||
| Terminal Value | -22,319 | |||||||||
| Present Terminal Value | -14,483 | |||||||||
| Enterprise Value | -20,845 | |||||||||
| Net Debt | 2,965 | |||||||||
| Equity Value | -23,810 | |||||||||
| Diluted Shares Outstanding, MM | 2,353 | |||||||||
| Equity Value Per Share | -10.12 |
What You Will Receive
- Authentic 5i5j Financial Data: Pre-loaded with historical and forecasted data for accurate analysis.
- Completely Customizable Template: Effortlessly adjust essential inputs such as revenue growth, WACC, and EBITDA %.
- Instant Calculations: View real-time updates to 5i5j's intrinsic value as you make adjustments.
- Professional Valuation Tool: Tailored for investors, analysts, and consultants in pursuit of precise DCF results.
- Intuitive Design: Clear layout and straightforward instructions suitable for all skill levels.
Key Features
- Customizable Forecast Parameters: Adjust essential metrics such as revenue growth, EBITDA %, and capital expenditures.
- Instant DCF Valuation: Provides immediate calculations for intrinsic value, NPV, and more.
- High-Precision Accuracy: Leverages 5i5j Holding Group's actual financial data for accurate valuation results.
- Easy Scenario Analysis: Effortlessly evaluate various assumptions and analyze different outcomes.
- Time-Efficient Solution: Avoid the complexities of constructing valuation models from the ground up.
How It Works
- Step 1: Download the ready-made Excel template featuring 5i5j Holding Group Co., Ltd.’s [000560SZ] data.
- Step 2: Review the pre-filled sheets to familiarize yourself with the essential metrics.
- Step 3: Adjust forecasts and assumptions in the editable yellow cells (WACC, growth, margins).
- Step 4: Immediately see the updated results, including the intrinsic value of 5i5j Holding Group Co., Ltd.
- Step 5: Utilize the outputs to make informed investment choices or create detailed reports.
Why Choose the 5i5j Holding Group Co., Ltd. ([000560SZ]) Calculator?
- All-in-One Solution: Combines DCF, WACC, and financial ratio analyses for a comprehensive financial overview.
- Flexible Inputs: Modify yellow-highlighted cells to explore different financial scenarios.
- In-Depth Analysis: Automatically determines the intrinsic value and Net Present Value of 5i5j Holding Group.
- Loaded with Data: Comes with historical and projected data for reliable calculations from the outset.
- Expert-Level Tool: Perfect for financial analysts, savvy investors, and business consultants.
Who Can Benefit from This Product?
- Investors: Assess the fair value of 5i5j Holding Group Co., Ltd. (000560SZ) to inform your investment choices.
- CFOs: Utilize a professional-grade DCF model for enhanced financial reporting and analysis.
- Consultants: Effortlessly modify the template for client valuation reports.
- Entrepreneurs: Discover financial modeling techniques employed by leading companies.
- Educators: Incorporate it into your curriculum to illustrate valuation methods.
What the Template Includes
- Pre-Filled DCF Model: 5i5j Holding Group's financial data preloaded for instant access.
- WACC Calculator: Comprehensive calculations for Weighted Average Cost of Capital.
- Financial Ratios: Assess 5i5j Holding Group’s profitability, leverage, and operational efficiency.
- Editable Inputs: Adjust assumptions such as growth rates, profit margins, and CAPEX to tailor your analysis.
- Financial Statements: Annual and quarterly reports to facilitate thorough examination.
- Interactive Dashboard: Effortlessly visualize essential valuation metrics and outcomes.
Disclaimer
All information, articles, and product details provided on this website are for general informational and educational purposes only. We do not claim any ownership over, nor do we intend to infringe upon, any trademarks, copyrights, logos, brand names, or other intellectual property mentioned or depicted on this site. Such intellectual property remains the property of its respective owners, and any references here are made solely for identification or informational purposes, without implying any affiliation, endorsement, or partnership.
We make no representations or warranties, express or implied, regarding the accuracy, completeness, or suitability of any content or products presented. Nothing on this website should be construed as legal, tax, investment, financial, medical, or other professional advice. In addition, no part of this site—including articles or product references—constitutes a solicitation, recommendation, endorsement, advertisement, or offer to buy or sell any securities, franchises, or other financial instruments, particularly in jurisdictions where such activity would be unlawful.
All content is of a general nature and may not address the specific circumstances of any individual or entity. It is not a substitute for professional advice or services. Any actions you take based on the information provided here are strictly at your own risk. You accept full responsibility for any decisions or outcomes arising from your use of this website and agree to release us from any liability in connection with your use of, or reliance upon, the content or products found herein.