
|
Power Assets Holdings Limited (0006.hk) Évaluation DCF |
Entièrement Modifiable: Adapté À Vos Besoins Dans Excel Ou Sheets
Conception Professionnelle: Modèles Fiables Et Conformes Aux Normes Du Secteur
Pré-Construits Pour Une Utilisation Rapide Et Efficace
Compatible MAC/PC, entièrement débloqué
Aucune Expertise N'Est Requise; Facile À Suivre
Power Assets Holdings Limited (0006.HK) Bundle
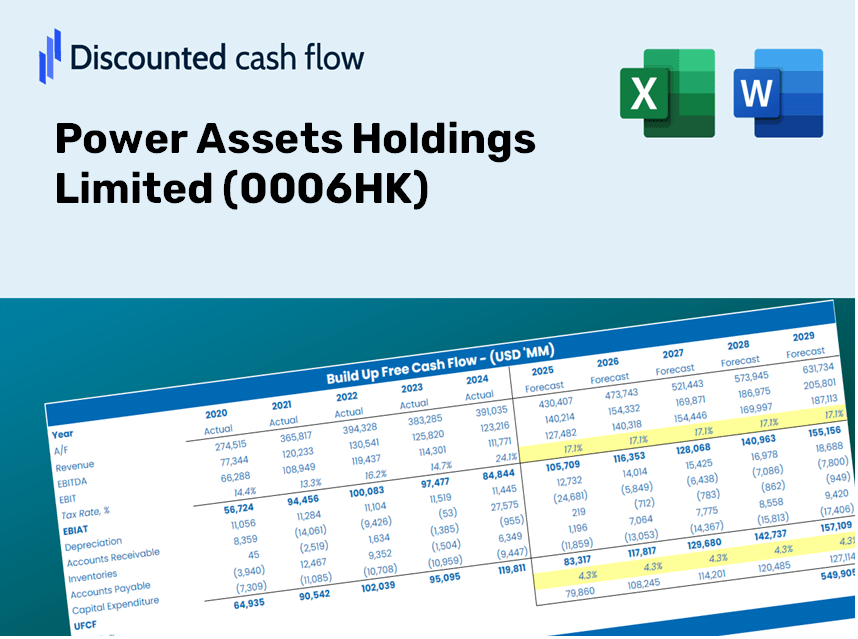
Explorez les perspectives financières de Power Assets Holdings Limited (0006HK) à l'aide de notre calculatrice DCF conviviale! Entrez vos projections pour la croissance, les marges bénéficiaires et les dépenses pour calculer la valeur intrinsèque de Power Assets Holdings Limited (0006HK) et affiner votre approche d'investissement.
Discounted Cash Flow (DCF) - (USD MM)
| Year | AY1 2020 |
AY2 2021 |
AY3 2022 |
AY4 2023 |
AY5 2024 |
FY1 2025 |
FY2 2026 |
FY3 2027 |
FY4 2028 |
FY5 2029 |
|---|---|---|---|---|---|---|---|---|---|---|
| Revenue | 1,270.0 | 1,276.0 | 1,265.0 | 1,292.0 | 6,774.0 | 8,497.0 | 10,658.4 | 13,369.5 | 16,770.1 | 21,035.8 |
| Revenue Growth, % | 0 | 0.47244 | -0.86207 | 2.13 | 424.3 | 25.44 | 25.44 | 25.44 | 25.44 | 25.44 |
| EBITDA | 1,313.0 | 1,489.0 | 1,165.0 | 1,135.0 | 6,524.0 | 8,093.5 | 10,152.2 | 12,734.5 | 15,973.6 | 20,036.7 |
| EBITDA, % | 103.39 | 116.69 | 92.09 | 87.85 | 96.31 | 95.25 | 95.25 | 95.25 | 95.25 | 95.25 |
| Depreciation | 4.0 | 3.0 | 3.0 | 4.0 | 3.0 | 19.4 | 24.3 | 30.5 | 38.3 | 48.0 |
| Depreciation, % | 0.31496 | 0.23511 | 0.23715 | 0.3096 | 0.04428698 | 0.22822 | 0.22822 | 0.22822 | 0.22822 | 0.22822 |
| EBIT | 1,309.0 | 1,486.0 | 1,162.0 | 1,131.0 | 6,521.0 | 8,083.4 | 10,139.6 | 12,718.7 | 15,953.8 | 20,011.9 |
| EBIT, % | 103.07 | 116.46 | 91.86 | 87.54 | 96.27 | 95.13 | 95.13 | 95.13 | 95.13 | 95.13 |
| Total Cash | 5,427.0 | 4,610.0 | 5,894.0 | 4,201.0 | 2,733.0 | 7,483.3 | 9,386.7 | 11,774.4 | 14,769.3 | 18,526.1 |
| Total Cash, percent | .0 | .0 | .0 | .0 | .0 | .0 | .0 | .0 | .0 | .0 |
| Account Receivables | 635.0 | 353.0 | 986.0 | 158.0 | 755.0 | 3,041.7 | 3,815.4 | 4,785.8 | 6,003.2 | 7,530.1 |
| Account Receivables, % | 50 | 27.66 | 77.94 | 12.23 | 11.15 | 35.8 | 35.8 | 35.8 | 35.8 | 35.8 |
| Inventories | -632.0 | -351.0 | -984.0 | .0 | .0 | -2,635.1 | -3,305.3 | -4,146.1 | -5,200.7 | -6,523.6 |
| Inventories, % | -49.76 | -27.51 | -77.79 | 0 | 0 | -31.01 | -31.01 | -31.01 | -31.01 | -31.01 |
| Accounts Payable | 3,397.0 | 3,384.0 | 3,915.0 | 2,896.0 | 3,967.0 | 7,792.8 | 9,775.1 | 12,261.5 | 15,380.3 | 19,292.5 |
| Accounts Payable, % | 267.48 | 265.2 | 309.49 | 224.15 | 58.56 | 91.71 | 91.71 | 91.71 | 91.71 | 91.71 |
| Capital Expenditure | -2.0 | .0 | -1.0 | -2.0 | .0 | -6.7 | -8.3 | -10.5 | -13.1 | -16.5 |
| Capital Expenditure, % | -0.15748 | 0 | -0.07905138 | -0.1548 | 0 | -0.07826609 | -0.07826609 | -0.07826609 | -0.07826609 | -0.07826609 |
| Tax Rate, % | 3.67 | 3.67 | 3.67 | 3.67 | 3.67 | 3.67 | 3.67 | 3.67 | 3.67 | 3.67 |
| EBITAT | 1,294.6 | 1,454.7 | 1,124.4 | 1,086.0 | 6,281.8 | 7,855.7 | 9,853.8 | 12,360.3 | 15,504.3 | 19,447.9 |
| Depreciation | ||||||||||
| Changes in Account Receivables | ||||||||||
| Changes in Inventories | ||||||||||
| Changes in Accounts Payable | ||||||||||
| Capital Expenditure | ||||||||||
| UFCF | 4,690.6 | 1,445.7 | 1,657.4 | -87.0 | 6,758.8 | 12,042.6 | 11,748.6 | 14,737.0 | 18,485.5 | 23,187.5 |
| WACC, % | 6.16 | 6.15 | 6.15 | 6.15 | 6.15 | 6.15 | 6.15 | 6.15 | 6.15 | 6.15 |
| PV UFCF | ||||||||||
| SUM PV UFCF | 65,851.8 | |||||||||
| Long Term Growth Rate, % | 2.00 | |||||||||
| Free cash flow (T + 1) | 23,651 | |||||||||
| Terminal Value | 569,534 | |||||||||
| Present Terminal Value | 422,536 | |||||||||
| Enterprise Value | 488,388 | |||||||||
| Net Debt | -224 | |||||||||
| Equity Value | 488,612 | |||||||||
| Diluted Shares Outstanding, MM | 2,131 | |||||||||
| Equity Value Per Share | 229.28 |
Benefits You Will Receive
- Adjustable Forecast Parameters: Effortlessly modify key assumptions (growth %, margins, WACC) to explore various scenarios.
- Relevant Financial Data: Power Assets Holdings Limited’s financial information pre-loaded to accelerate your analysis.
- Automated DCF Calculations: The template computes Net Present Value (NPV) and intrinsic value on your behalf.
- Customizable and Professional Design: A refined Excel model tailored to meet your valuation requirements.
- Designed for Analysts and Investors: Perfect for assessing projections, verifying strategies, and enhancing efficiency.
Key Features
- Accurate Financial Data: Gain access to reliable pre-loaded historical figures and future forecasts for Power Assets Holdings Limited (0006HK).
- Customizable Assumptions: Modify the yellow-highlighted fields such as WACC, growth rates, and profit margins.
- Real-Time Calculations: Automatic recalculations for DCF, Net Present Value (NPV), and cash flow assessments.
- User-Friendly Dashboard: Intuitive charts and summaries to effectively illustrate your valuation findings.
- Designed for All Levels: A straightforward structure suitable for investors, CFOs, and consultants alike.
How It Operates
- Download the Template: Gain instant access to the Excel-based Power Assets Holdings DCF Calculator.
- Input Your Assumptions: Modify the yellow-highlighted cells for growth rates, WACC, margins, and other variables.
- Instant Calculations: The model automatically recalculates the intrinsic value of Power Assets Holdings (0006HK).
- Test Scenarios: Experiment with various assumptions to assess potential changes in valuation.
- Analyze and Decide: Utilize the results to inform your investment or financial analysis decisions.
Why Select This Calculator for Power Assets Holdings Limited (0006HK)?
- Designed for Experts: A sophisticated tool tailored for analysts, CFOs, and financial consultants.
- Accurate Financials: Historical and projected financial data for Power Assets Holdings Limited (0006HK) preloaded for precision.
- Flexible Scenario Analysis: Effortlessly simulate various forecasts and assumptions.
- Transparent Results: Automatically computes intrinsic value, NPV, and essential metrics.
- User-Friendly: Comprehensive step-by-step guidance makes the process simple.
Who Should Benefit from Power Assets Holdings Limited (0006HK)?
- Individual Investors: Gain insights to make informed decisions regarding buying or selling shares of Power Assets Holdings Limited (0006HK).
- Financial Analysts: Enhance valuation practices with accessible financial models tailored for Power Assets Holdings Limited (0006HK).
- Consultants: Provide clients with swift and precise valuation analyses related to Power Assets Holdings Limited (0006HK).
- Business Owners: Learn about the valuation methods used for large entities like Power Assets Holdings Limited (0006HK) to inform your business strategies.
- Finance Students: Explore valuation methodologies utilizing real-world data and scenarios from Power Assets Holdings Limited (0006HK).
Overview of the Template Contents
- Historical Data: Features Power Assets Holdings Limited's (0006HK) previous financial performance and foundational forecasts.
- DCF and Levered DCF Models: Comprehensive templates designed to assess the intrinsic value of Power Assets Holdings Limited (0006HK).
- WACC Sheet: Pre-configured calculations for the Weighted Average Cost of Capital.
- Editable Inputs: Adjust essential drivers such as growth rates, EBITDA margins, and CAPEX forecasts.
- Quarterly and Annual Statements: A thorough analysis of Power Assets Holdings Limited's (0006HK) financials.
- Interactive Dashboard: Dynamically visualize valuation results and forecasts.
Disclaimer
All information, articles, and product details provided on this website are for general informational and educational purposes only. We do not claim any ownership over, nor do we intend to infringe upon, any trademarks, copyrights, logos, brand names, or other intellectual property mentioned or depicted on this site. Such intellectual property remains the property of its respective owners, and any references here are made solely for identification or informational purposes, without implying any affiliation, endorsement, or partnership.
We make no representations or warranties, express or implied, regarding the accuracy, completeness, or suitability of any content or products presented. Nothing on this website should be construed as legal, tax, investment, financial, medical, or other professional advice. In addition, no part of this site—including articles or product references—constitutes a solicitation, recommendation, endorsement, advertisement, or offer to buy or sell any securities, franchises, or other financial instruments, particularly in jurisdictions where such activity would be unlawful.
All content is of a general nature and may not address the specific circumstances of any individual or entity. It is not a substitute for professional advice or services. Any actions you take based on the information provided here are strictly at your own risk. You accept full responsibility for any decisions or outcomes arising from your use of this website and agree to release us from any liability in connection with your use of, or reliance upon, the content or products found herein.