
|
Guangdong Golden Dragon Development Inc. (000712.SZ) Valation DCF |
Entièrement Modifiable: Adapté À Vos Besoins Dans Excel Ou Sheets
Conception Professionnelle: Modèles Fiables Et Conformes Aux Normes Du Secteur
Pré-Construits Pour Une Utilisation Rapide Et Efficace
Compatible MAC/PC, entièrement débloqué
Aucune Expertise N'Est Requise; Facile À Suivre
Guangdong Golden Dragon Development Inc. (000712.SZ) Bundle
Améliorez vos choix d'investissement avec la calculatrice DCF Guangdong Golden Dragon Development Inc. (000712SZ)! Explorez les données financières réelles, ajustez les projections et les dépenses de croissance et observez comment ces modifications affectent la valeur intrinsèque de Guangdong Golden Dragon Development Inc. (000712SZ) en temps réel.
Discounted Cash Flow (DCF) - (USD MM)
| Year | AY1 2020 |
AY2 2021 |
AY3 2022 |
AY4 2023 |
AY5 2024 |
FY1 2025 |
FY2 2026 |
FY3 2027 |
FY4 2028 |
FY5 2029 |
|---|---|---|---|---|---|---|---|---|---|---|
| Revenue | 1,360.3 | 606.3 | -66.7 | -68.3 | 292.7 | 107.5 | 39.5 | 14.5 | 5.3 | 2.0 |
| Revenue Growth, % | 0 | -55.43 | -111 | 2.37 | -528.76 | -63.27 | -63.27 | -63.27 | -63.27 | -63.27 |
| EBITDA | 192.2 | .0 | .0 | .0 | .0 | 3.0 | 1.1 | .4 | .2 | .1 |
| EBITDA, % | 14.13 | 0 | 0 | 0 | 0 | 2.83 | 2.83 | 2.83 | 2.83 | 2.83 |
| Depreciation | 1,790.0 | 1,317.1 | 1,000.2 | 64.2 | 59.4 | 5.6 | 2.1 | .8 | .3 | .1 |
| Depreciation, % | 131.58 | 217.24 | -1499.76 | -94.08 | 20.3 | 5.24 | 5.24 | 5.24 | 5.24 | 5.24 |
| EBIT | -1,597.8 | -1,317.1 | -1,000.2 | -64.2 | -59.4 | -5.6 | -2.1 | -.8 | -.3 | -.1 |
| EBIT, % | -117.46 | -217.24 | 1499.76 | 94.08 | -20.3 | -5.24 | -5.24 | -5.24 | -5.24 | -5.24 |
| Total Cash | 7,315.3 | 7,607.7 | 9,168.9 | 8,787.6 | 10,983.8 | 21.5 | 7.9 | 2.9 | 1.1 | .4 |
| Total Cash, percent | .0 | .0 | .0 | .0 | .0 | .0 | .0 | .0 | .0 | .0 |
| Account Receivables | 133.1 | 133.8 | 1,877.4 | 37.7 | 14.2 | -25.5 | -9.4 | -3.4 | -1.3 | -.5 |
| Account Receivables, % | 9.78 | 22.08 | -2815.17 | -55.27 | 4.86 | -23.71 | -23.71 | -23.71 | -23.71 | -23.71 |
| Inventories | 2,999.4 | 3,072.3 | 3,001.7 | .0 | .0 | 21.5 | 7.9 | 2.9 | 1.1 | .4 |
| Inventories, % | 220.49 | 506.75 | -4501.04 | 0 | 0 | 20 | 20 | 20 | 20 | 20 |
| Accounts Payable | 250.3 | 204.6 | 194.8 | 177.1 | 216.4 | -15.9 | -5.8 | -2.1 | -.8 | -.3 |
| Accounts Payable, % | 18.4 | 33.75 | -292.04 | -259.35 | 73.93 | -14.79 | -14.79 | -14.79 | -14.79 | -14.79 |
| Capital Expenditure | -92.6 | -93.7 | -95.4 | -83.1 | -100.3 | -12.2 | -4.5 | -1.6 | -.6 | -.2 |
| Capital Expenditure, % | -6.8 | -15.46 | 143.03 | 121.67 | -34.26 | -11.31 | -11.31 | -11.31 | -11.31 | -11.31 |
| Tax Rate, % | -402.79 | -402.79 | -402.79 | -402.79 | -402.79 | -402.79 | -402.79 | -402.79 | -402.79 | -402.79 |
| EBITAT | -969.5 | -1,062.8 | -847.5 | -51.5 | -298.7 | -4.6 | -1.7 | -.6 | -.2 | -.1 |
| Depreciation | ||||||||||
| Changes in Account Receivables | ||||||||||
| Changes in Inventories | ||||||||||
| Changes in Accounts Payable | ||||||||||
| Capital Expenditure | ||||||||||
| UFCF | -2,154.2 | 41.1 | -1,625.5 | 4,753.4 | -276.8 | -225.2 | 3.5 | 1.3 | .5 | .2 |
| WACC, % | 4.91 | 5.5 | 5.62 | 5.49 | 6.07 | 5.52 | 5.52 | 5.52 | 5.52 | 5.52 |
| PV UFCF | ||||||||||
| SUM PV UFCF | -208.7 | |||||||||
| Long Term Growth Rate, % | 2.00 | |||||||||
| Free cash flow (T + 1) | 0 | |||||||||
| Terminal Value | 5 | |||||||||
| Present Terminal Value | 4 | |||||||||
| Enterprise Value | -205 | |||||||||
| Net Debt | -10,984 | |||||||||
| Equity Value | 10,779 | |||||||||
| Diluted Shares Outstanding, MM | 896 | |||||||||
| Equity Value Per Share | 12.03 |
Benefits You Will Receive
- Customizable Excel Template: A fully adjustable Excel-based DCF Calculator featuring pre-loaded financials for Guangdong Golden Dragon Development Inc. (000712SZ).
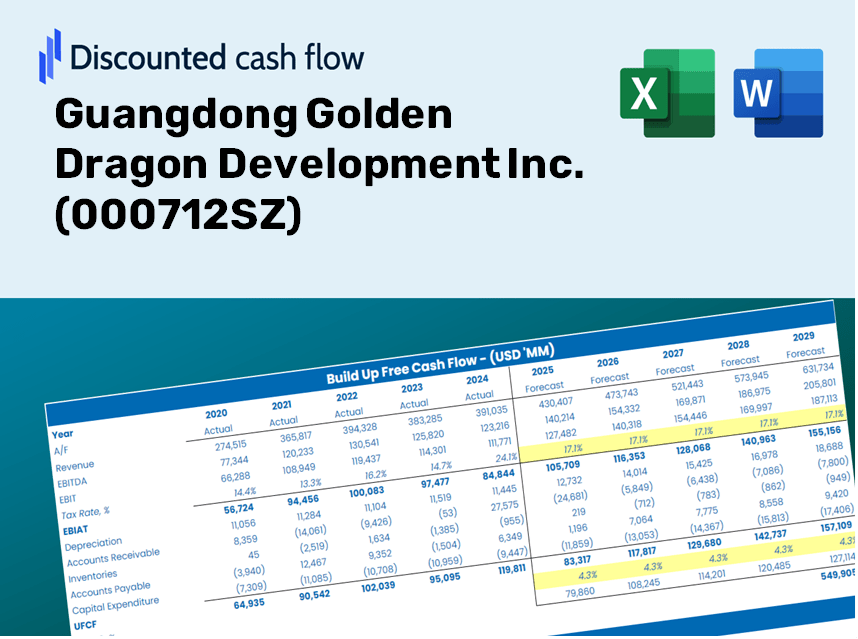
- Up-to-Date Financial Data: Access to historical figures and future projections (outlined in the highlighted cells).
- Flexible Forecasting: Alter key assumptions such as revenue growth, EBITDA percentage, and WACC to suit your analysis.
- Instant Calculations: Quickly assess how your adjustments influence the valuation of Guangdong Golden Dragon Development Inc. (000712SZ).
- Professional-Grade Tool: Designed for investors, CFOs, consultants, and financial analysts.
- User-Centric Layout: Organized for straightforward navigation and ease of use, complete with step-by-step guidance.
Key Features
- Customizable Forecast Inputs: Adjust essential variables such as revenue growth, EBITDA percentage, and capital investments.
- Instant DCF Valuation: Provides immediate calculations of intrinsic value, NPV, and other key metrics.
- High Precision Results: Leverages Guangdong Golden Dragon Development Inc.'s financial data for accurate valuation results.
- Simplified Scenario Analysis: Effortlessly evaluate varying assumptions and analyze different outcomes.
- Efficiency Enhancer: Streamlines the valuation process, eliminating the need for complex model constructions.
How It Operates
- Download the Template: Gain immediate access to the Excel-based GDD DCF Calculator for Guangdong Golden Dragon Development Inc. (000712SZ).
- Input Your Assumptions: Modify the yellow-highlighted cells for growth rates, WACC, profit margins, and additional parameters.
- Instant Calculations: The model automatically refreshes to reflect the intrinsic value of Guangdong Golden Dragon Development Inc. (000712SZ).
- Test Scenarios: Run simulations with various assumptions to assess potential changes in valuation.
- Analyze and Decide: Utilize the results to inform your investment strategies or financial assessments.
Why Choose This Calculator for Guangdong Golden Dragon Development Inc. (000712SZ)?
- User-Friendly Interface: Tailored for both novices and seasoned professionals.
- Customizable Assumptions: Easily adjust inputs to suit your specific analysis needs.
- Real-Time Updates: Observe immediate changes in Guangdong Golden Dragon’s valuation as you modify inputs.
- Instant Access: Comes preloaded with Guangdong Golden Dragon’s current financial data for swift evaluations.
- Widely Respected: Favored by investors and analysts for making well-informed decisions.
Who Can Benefit from [000712SZ]?
- Investors: Make informed investment decisions with an advanced valuation tool tailored for [000712SZ].
- Financial Analysts: Streamline your workflow using a customizable DCF model specifically designed for [000712SZ].
- Consultants: Efficiently modify the template to create client presentations or reports focused on [000712SZ].
- Finance Enthusiasts: Enhance your grasp of valuation methods through practical examples related to [000712SZ].
- Educators and Students: Utilize it as a hands-on resource for finance courses covering [000712SZ].
Contents of the Template
- Operating and Balance Sheet Data: Pre-filled historical data and forecasts for Guangdong Golden Dragon Development Inc. (000712SZ), including revenue, EBITDA, EBIT, and capital expenditures.
- WACC Calculation: A dedicated sheet for calculating the Weighted Average Cost of Capital (WACC), featuring parameters such as Beta, risk-free rate, and share price.
- DCF Valuation (Unlevered and Levered): Customizable Discounted Cash Flow models to assess intrinsic value with comprehensive calculations.
- Financial Statements: Pre-loaded annual and quarterly financial statements to facilitate detailed analysis.
- Key Ratios: Provides essential profitability, leverage, and efficiency ratios for Guangdong Golden Dragon Development Inc. (000712SZ).
- Dashboard and Charts: A visual summary of valuation outputs and assumptions to enable easy results analysis.
Disclaimer
All information, articles, and product details provided on this website are for general informational and educational purposes only. We do not claim any ownership over, nor do we intend to infringe upon, any trademarks, copyrights, logos, brand names, or other intellectual property mentioned or depicted on this site. Such intellectual property remains the property of its respective owners, and any references here are made solely for identification or informational purposes, without implying any affiliation, endorsement, or partnership.
We make no representations or warranties, express or implied, regarding the accuracy, completeness, or suitability of any content or products presented. Nothing on this website should be construed as legal, tax, investment, financial, medical, or other professional advice. In addition, no part of this site—including articles or product references—constitutes a solicitation, recommendation, endorsement, advertisement, or offer to buy or sell any securities, franchises, or other financial instruments, particularly in jurisdictions where such activity would be unlawful.
All content is of a general nature and may not address the specific circumstances of any individual or entity. It is not a substitute for professional advice or services. Any actions you take based on the information provided here are strictly at your own risk. You accept full responsibility for any decisions or outcomes arising from your use of this website and agree to release us from any liability in connection with your use of, or reliance upon, the content or products found herein.