
|
Jinneng Holding Shanxi Electric Power Co., Ltd. (000767.sz) Évaluation DCF |
Entièrement Modifiable: Adapté À Vos Besoins Dans Excel Ou Sheets
Conception Professionnelle: Modèles Fiables Et Conformes Aux Normes Du Secteur
Pré-Construits Pour Une Utilisation Rapide Et Efficace
Compatible MAC/PC, entièrement débloqué
Aucune Expertise N'Est Requise; Facile À Suivre
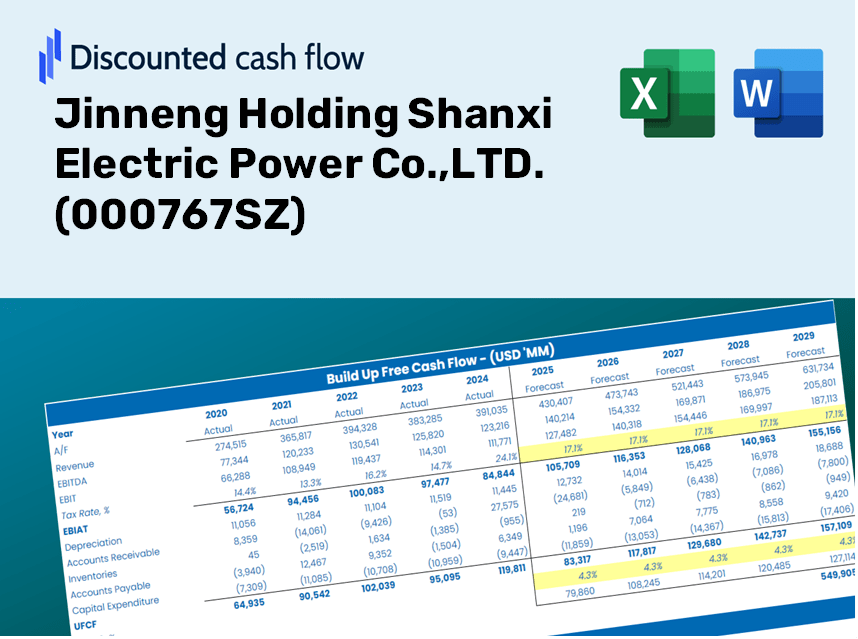
Jinneng Holding Shanxi Electric Power Co.,LTD. (000767.SZ) Bundle
Vous cherchez à déterminer la valeur intrinsèque de Jinneng tenant Shanxi Electric Power Co., Ltd.? Notre calculatrice DCF (000767SZ) intègre des données réelles à des fonctionnalités personnalisables, vous permettant d'affiner vos prévisions et de faire des choix d'investissement plus éclairés.
Discounted Cash Flow (DCF) - (USD MM)
| Year | AY1 2020 |
AY2 2021 |
AY3 2022 |
AY4 2023 |
AY5 2024 |
FY1 2025 |
FY2 2026 |
FY3 2027 |
FY4 2028 |
FY5 2029 |
|---|---|---|---|---|---|---|---|---|---|---|
| Revenue | 11,864.0 | 15,274.8 | 20,219.7 | 19,615.7 | 16,669.7 | 18,466.5 | 20,457.0 | 22,662.1 | 25,104.8 | 27,810.9 |
| Revenue Growth, % | 0 | 28.75 | 32.37 | -2.99 | -15.02 | 10.78 | 10.78 | 10.78 | 10.78 | 10.78 |
| EBITDA | 3,966.6 | 3,936.8 | 3,211.0 | 3,452.2 | 3,493.5 | 4,197.2 | 4,649.6 | 5,150.8 | 5,706.0 | 6,321.1 |
| EBITDA, % | 33.43 | 25.77 | 15.88 | 17.6 | 20.96 | 22.73 | 22.73 | 22.73 | 22.73 | 22.73 |
| Depreciation | 1,908.5 | 1,940.5 | 2,167.2 | 2,377.5 | 2,404.9 | 2,439.6 | 2,702.6 | 2,993.9 | 3,316.6 | 3,674.1 |
| Depreciation, % | 16.09 | 12.7 | 10.72 | 12.12 | 14.43 | 13.21 | 13.21 | 13.21 | 13.21 | 13.21 |
| EBIT | 2,058.1 | 1,996.3 | 1,043.8 | 1,074.7 | 1,088.6 | 1,757.6 | 1,947.0 | 2,156.9 | 2,389.4 | 2,646.9 |
| EBIT, % | 17.35 | 13.07 | 5.16 | 5.48 | 6.53 | 9.52 | 9.52 | 9.52 | 9.52 | 9.52 |
| Total Cash | 4,818.6 | 6,641.4 | 9,794.2 | 6,947.8 | 3,697.0 | 7,022.1 | 7,779.0 | 8,617.5 | 9,546.4 | 10,575.4 |
| Total Cash, percent | .0 | .0 | .0 | .0 | .0 | .0 | .0 | .0 | .0 | .0 |
| Account Receivables | 5,082.2 | 7,698.5 | 8,299.8 | 9,236.8 | 9,598.2 | 8,825.2 | 9,776.5 | 10,830.3 | 11,997.7 | 13,291.0 |
| Account Receivables, % | 42.84 | 50.4 | 41.05 | 47.09 | 57.58 | 47.79 | 47.79 | 47.79 | 47.79 | 47.79 |
| Inventories | 1,049.5 | 1,932.2 | 1,373.3 | 1,416.0 | 1,767.3 | 1,702.9 | 1,886.5 | 2,089.8 | 2,315.1 | 2,564.6 |
| Inventories, % | 8.85 | 12.65 | 6.79 | 7.22 | 10.6 | 9.22 | 9.22 | 9.22 | 9.22 | 9.22 |
| Accounts Payable | 12,246.8 | 14,893.7 | 13,690.6 | 6,731.2 | 7,216.4 | 12,661.3 | 14,026.1 | 15,538.0 | 17,212.9 | 19,068.2 |
| Accounts Payable, % | 103.23 | 97.51 | 67.71 | 34.32 | 43.29 | 68.56 | 68.56 | 68.56 | 68.56 | 68.56 |
| Capital Expenditure | -3,348.4 | -1,468.4 | -1,978.8 | -1,670.1 | -2,323.5 | -2,588.1 | -2,867.1 | -3,176.1 | -3,518.5 | -3,897.7 |
| Capital Expenditure, % | -28.22 | -9.61 | -9.79 | -8.51 | -13.94 | -14.02 | -14.02 | -14.02 | -14.02 | -14.02 |
| Tax Rate, % | 233.07 | 233.07 | 233.07 | 233.07 | 233.07 | 233.07 | 233.07 | 233.07 | 233.07 | 233.07 |
| EBITAT | 1,180.7 | 288.8 | 1,126.8 | 1,138.4 | -1,448.6 | 955.5 | 1,058.5 | 1,172.6 | 1,299.0 | 1,439.1 |
| Depreciation | ||||||||||
| Changes in Account Receivables | ||||||||||
| Changes in Inventories | ||||||||||
| Changes in Accounts Payable | ||||||||||
| Capital Expenditure | ||||||||||
| UFCF | 5,855.9 | -91.3 | 69.6 | -6,093.2 | -1,594.7 | 7,089.4 | 1,124.0 | 1,245.1 | 1,379.4 | 1,528.0 |
| WACC, % | 4.02 | 2.2 | 5.82 | 5.82 | 1.59 | 3.89 | 3.89 | 3.89 | 3.89 | 3.89 |
| PV UFCF | ||||||||||
| SUM PV UFCF | 11,421.8 | |||||||||
| Long Term Growth Rate, % | 3.40 | |||||||||
| Free cash flow (T + 1) | 1,580 | |||||||||
| Terminal Value | 320,556 | |||||||||
| Present Terminal Value | 264,835 | |||||||||
| Enterprise Value | 276,257 | |||||||||
| Net Debt | 25,029 | |||||||||
| Equity Value | 251,228 | |||||||||
| Diluted Shares Outstanding, MM | 3,077 | |||||||||
| Equity Value Per Share | 81.65 |
What You Will Receive
- Authentic 000767SZ Financials: Access to historical and projected data for precise valuation.
- Customizable Inputs: Adjust parameters such as WACC, tax rates, revenue growth, and capital investments.
- Automated Calculations: Intrinsic value and NPV are computed in real-time.
- Scenario Analysis: Explore various scenarios to assess the future performance of Jinneng Holding Shanxi Electric Power Co., LTD.
- User-Friendly and Intuitive Interface: Designed for industry professionals, yet simple enough for newcomers.
Key Features
- Pre-Loaded Data: Jinneng Holding Shanxi Electric Power Co., LTD.'s historical financial statements and pre-filled forecasts.
- Fully Adjustable Inputs: Customize WACC, tax rates, revenue growth, and EBITDA margins.
- Instant Results: Witness the intrinsic value of Jinneng Holding Shanxi Electric Power Co., LTD. recalculating in real-time.
- Clear Visual Outputs: Dashboard charts showcase valuation results and essential metrics.
- Built for Accuracy: A professional tool designed for analysts, investors, and finance professionals.
How It Operates
- Step 1: Download the Excel file.
- Step 2: Review Jinneng Holding Shanxi Electric Power Co., LTD.'s pre-filled financial data and projections.
- Step 3: Adjust key variables such as revenue growth, WACC, and tax rates (highlighted cells).
- Step 4: Observe the DCF model refresh in real-time as you modify your assumptions.
- Step 5: Evaluate the results and leverage the findings for investment strategies.
Why Opt for This Calculator?
- Save Time: Skip building a DCF model from the ground up – it’s pre-configured for immediate use.
- Enhance Accuracy: Dependable financial data and formulas minimize valuation errors.
- Fully Customizable: Adjust the model to suit your specific assumptions and forecasts.
- Easy to Analyze: Intuitive charts and outputs facilitate straightforward result interpretation.
- Trusted by Professionals: Crafted for experts at Jinneng Holding Shanxi Electric Power Co., LTD. (000767SZ) who prioritize precision and functionality.
Who Should Consider This Product?
- Professional Investors: Create comprehensive and reliable valuation models for portfolio assessments focused on Jinneng Holding Shanxi Electric Power Co.,LTD. (000767SZ).
- Corporate Finance Teams: Evaluate valuation scenarios to inform strategic decisions within the organization.
- Consultants and Advisors: Deliver precise valuation insights to clients interested in the electric power sector.
- Students and Educators: Utilize real-world data to enhance learning and practice in financial modeling related to Jinneng Holding Shanxi Electric Power Co.,LTD. (000767SZ).
- Industry Enthusiasts: Gain a deeper understanding of how electric power companies like Jinneng are appraised in the financial market.
Contents of the Template
- Preloaded Jinneng Holding Data: Historical and projected financial metrics, including revenue, EBIT, and capital expenditures.
- DCF and WACC Models: High-quality sheets for calculating intrinsic value and Weighted Average Cost of Capital.
- Editable Inputs: Yellow-highlighted cells for modifying revenue growth, tax rates, and discount rates.
- Financial Statements: Detailed annual and quarterly financial statements for comprehensive analysis.
- Key Ratios: Profitability, leverage, and efficiency ratios for performance assessment.
- Dashboard and Charts: Visual representations of valuation results and underlying assumptions.
Disclaimer
All information, articles, and product details provided on this website are for general informational and educational purposes only. We do not claim any ownership over, nor do we intend to infringe upon, any trademarks, copyrights, logos, brand names, or other intellectual property mentioned or depicted on this site. Such intellectual property remains the property of its respective owners, and any references here are made solely for identification or informational purposes, without implying any affiliation, endorsement, or partnership.
We make no representations or warranties, express or implied, regarding the accuracy, completeness, or suitability of any content or products presented. Nothing on this website should be construed as legal, tax, investment, financial, medical, or other professional advice. In addition, no part of this site—including articles or product references—constitutes a solicitation, recommendation, endorsement, advertisement, or offer to buy or sell any securities, franchises, or other financial instruments, particularly in jurisdictions where such activity would be unlawful.
All content is of a general nature and may not address the specific circumstances of any individual or entity. It is not a substitute for professional advice or services. Any actions you take based on the information provided here are strictly at your own risk. You accept full responsibility for any decisions or outcomes arising from your use of this website and agree to release us from any liability in connection with your use of, or reliance upon, the content or products found herein.