
|
Yunnan Aluminium Co., Ltd. (000807.SZ) Valation DCF |
Entièrement Modifiable: Adapté À Vos Besoins Dans Excel Ou Sheets
Conception Professionnelle: Modèles Fiables Et Conformes Aux Normes Du Secteur
Pré-Construits Pour Une Utilisation Rapide Et Efficace
Compatible MAC/PC, entièrement débloqué
Aucune Expertise N'Est Requise; Facile À Suivre
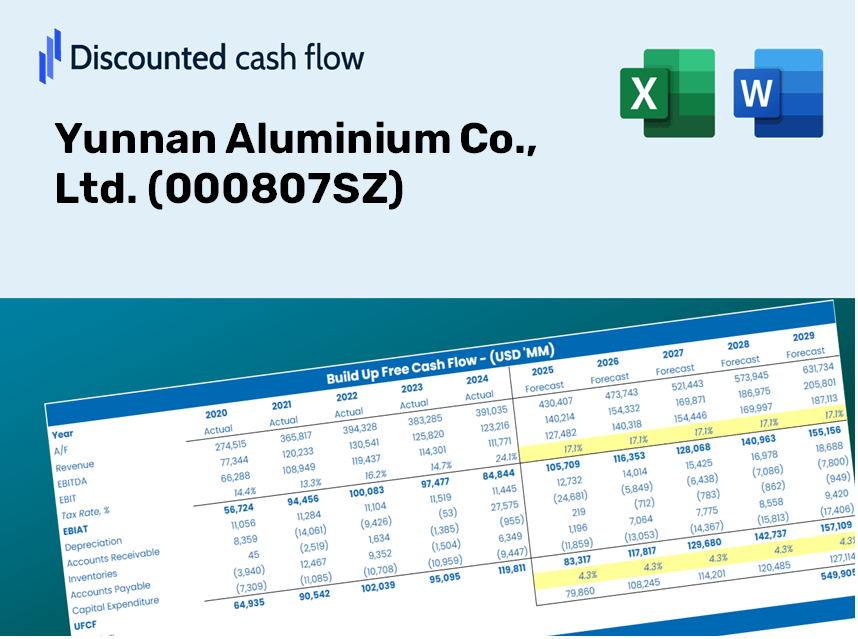
Yunnan Aluminium Co., Ltd. (000807.SZ) Bundle
Optimisez votre temps et améliorez la précision avec notre calculatrice DCF (000807SZ)! En utilisant des données réelles de Yunnan Aluminium Co., Ltd. et des hypothèses personnalisables, cet outil vous permet de prévoir, analyser et valoriser l'aluminium Yunnan comme un investisseur chevronné.
Discounted Cash Flow (DCF) - (USD MM)
| Year | AY1 2020 |
AY2 2021 |
AY3 2022 |
AY4 2023 |
AY5 2024 |
FY1 2025 |
FY2 2026 |
FY3 2027 |
FY4 2028 |
FY5 2029 |
|---|---|---|---|---|---|---|---|---|---|---|
| Revenue | 29,573.1 | 41,751.1 | 48,463.0 | 42,668.8 | 54,450.5 | 64,375.6 | 76,109.9 | 89,983.0 | 106,385.0 | 125,776.7 |
| Revenue Growth, % | 0 | 41.18 | 16.08 | -11.96 | 27.61 | 18.23 | 18.23 | 18.23 | 18.23 | 18.23 |
| EBITDA | 3,688.5 | 9,134.8 | 7,866.8 | 7,458.5 | 7,835.1 | 10,616.0 | 12,551.1 | 14,838.9 | 17,543.7 | 20,741.5 |
| EBITDA, % | 12.47 | 21.88 | 16.23 | 17.48 | 14.39 | 16.49 | 16.49 | 16.49 | 16.49 | 16.49 |
| Depreciation | 1,567.1 | 1,850.2 | 1,780.1 | 1,735.0 | 1,769.6 | 2,667.7 | 3,154.0 | 3,728.9 | 4,408.6 | 5,212.2 |
| Depreciation, % | 5.3 | 4.43 | 3.67 | 4.07 | 3.25 | 4.14 | 4.14 | 4.14 | 4.14 | 4.14 |
| EBIT | 2,121.4 | 7,284.6 | 6,086.7 | 5,723.5 | 6,065.6 | 7,948.3 | 9,397.1 | 11,110.0 | 13,135.1 | 15,529.3 |
| EBIT, % | 7.17 | 17.45 | 12.56 | 13.41 | 11.14 | 12.35 | 12.35 | 12.35 | 12.35 | 12.35 |
| Total Cash | 1,186.8 | 1,622.6 | 3,044.9 | 5,260.9 | 8,281.0 | 5,371.5 | 6,350.7 | 7,508.2 | 8,876.8 | 10,494.9 |
| Total Cash, percent | .0 | .0 | .0 | .0 | .0 | .0 | .0 | .0 | .0 | .0 |
| Account Receivables | 437.5 | 339.8 | 1,067.5 | 388.8 | 640.0 | 847.5 | 1,002.0 | 1,184.7 | 1,400.6 | 1,655.9 |
| Account Receivables, % | 1.48 | 0.81398 | 2.2 | 0.91132 | 1.18 | 1.32 | 1.32 | 1.32 | 1.32 | 1.32 |
| Inventories | 3,544.0 | 3,041.7 | 3,917.8 | 4,051.1 | 5,320.4 | 6,002.2 | 7,096.3 | 8,389.8 | 9,919.1 | 11,727.1 |
| Inventories, % | 11.98 | 7.29 | 8.08 | 9.49 | 9.77 | 9.32 | 9.32 | 9.32 | 9.32 | 9.32 |
| Accounts Payable | 9,362.6 | 5,157.6 | 5,811.7 | 3,673.7 | 1,982.8 | 8,788.0 | 10,389.9 | 12,283.7 | 14,522.8 | 17,169.9 |
| Accounts Payable, % | 31.66 | 12.35 | 11.99 | 8.61 | 3.64 | 13.65 | 13.65 | 13.65 | 13.65 | 13.65 |
| Capital Expenditure | -5,286.6 | -1,274.2 | -963.5 | -733.0 | -658.1 | -3,327.3 | -3,933.8 | -4,650.8 | -5,498.6 | -6,500.9 |
| Capital Expenditure, % | -17.88 | -3.05 | -1.99 | -1.72 | -1.21 | -5.17 | -5.17 | -5.17 | -5.17 | -5.17 |
| Tax Rate, % | 26.13 | 26.13 | 26.13 | 26.13 | 26.13 | 26.13 | 26.13 | 26.13 | 26.13 | 26.13 |
| EBITAT | 1,411.5 | 5,161.1 | 4,707.7 | 4,084.2 | 4,480.5 | 5,722.1 | 6,765.1 | 7,998.2 | 9,456.1 | 11,179.7 |
| Depreciation | ||||||||||
| Changes in Account Receivables | ||||||||||
| Changes in Inventories | ||||||||||
| Changes in Accounts Payable | ||||||||||
| Capital Expenditure | ||||||||||
| UFCF | 3,073.0 | 2,132.1 | 4,574.7 | 3,493.4 | 2,380.7 | 10,978.3 | 6,338.5 | 7,493.9 | 8,859.9 | 10,474.9 |
| WACC, % | 9.93 | 9.94 | 9.95 | 9.94 | 9.95 | 9.94 | 9.94 | 9.94 | 9.94 | 9.94 |
| PV UFCF | ||||||||||
| SUM PV UFCF | 33,453.2 | |||||||||
| Long Term Growth Rate, % | 3.00 | |||||||||
| Free cash flow (T + 1) | 10,789 | |||||||||
| Terminal Value | 155,390 | |||||||||
| Present Terminal Value | 96,734 | |||||||||
| Enterprise Value | 130,187 | |||||||||
| Net Debt | -3,894 | |||||||||
| Equity Value | 134,081 | |||||||||
| Diluted Shares Outstanding, MM | 3,474 | |||||||||
| Equity Value Per Share | 38.60 |
What You Will Receive
- Customizable Excel Template: A fully editable DCF Calculator in Excel format featuring pre-populated financial data for Yunnan Aluminium Co., Ltd. (000807SZ).
- Actual Performance Data: Access to historical figures and projected estimates (displayed in the highlighted cells).
- Assumption Adjustability: Modify forecast variables such as revenue growth, EBITDA margin, and WACC.
- Instant Calculations: Quickly observe how your inputs influence the valuation of Yunnan Aluminium Co., Ltd. (000807SZ).
- Professional Resource: Designed for investors, CFOs, consultants, and financial analysts.
- User-Friendly Interface: Organized for simplicity and accessibility, complete with step-by-step guidance.
Key Features
- Pre-Loaded Data: Yunnan Aluminium Co., Ltd.'s historical financial statements and pre-filled forecasts.
- Fully Adjustable Inputs: Modify WACC, tax rates, revenue growth, and EBITDA margins as needed.
- Instant Results: Watch Yunnan Aluminium Co., Ltd.'s intrinsic value recalculate in real time.
- Clear Visual Outputs: Dashboard charts present valuation results and key metrics clearly.
- Built for Accuracy: A professional-grade tool for analysts, investors, and finance professionals.
How It Functions
- Obtain the Template: Gain immediate access to the Excel-based Yunnan Aluminium DCF Calculator.
- Enter Your Assumptions: Modify the yellow-highlighted cells for growth rates, WACC, profit margins, and other variables.
- Real-Time Calculations: The model automatically recalculates Yunnan Aluminium's intrinsic value.
- Experiment with Scenarios: Test various assumptions to assess potential changes in valuation.
- Evaluate and Decide: Leverage the outcomes to inform your investment or financial strategies.
Why Opt for This Calculator for Yunnan Aluminium Co., Ltd. (000807SZ)?
- Precise Information: Utilize actual Yunnan Aluminium financial data for trustworthy valuation outcomes.
- Tailorable: Modify essential parameters such as growth rates, WACC, and tax rates to align with your forecasts.
- Efficiency Boost: Built-in calculations save you the effort of starting from the ground up.
- Expert-Grade Toolkit: Created for investors, analysts, and industry consultants.
- Easy to Navigate: User-centric design and clear, step-by-step guidance cater to all levels of expertise.
Who Should Consider Yunnan Aluminium Co., Ltd. (000807SZ)?
- Investors: Leverage insights from a leading player in the aluminium industry to make informed investment choices.
- Financial Analysts: Utilize comprehensive data and analytics to streamline your evaluations of Yunnan Aluminium Co., Ltd. (000807SZ).
- Consultants: Tailor your presentations and reports with up-to-date information and market analysis specific to Yunnan Aluminium Co., Ltd. (000807SZ).
- Finance Enthusiasts: Enhance your knowledge of the aluminium sector with in-depth resources and case studies from Yunnan Aluminium Co., Ltd. (000807SZ).
- Educators and Students: Incorporate real-world examples from Yunnan Aluminium Co., Ltd. (000807SZ) into finance curricula for a practical learning experience.
Contents of the Template
- Pre-Filled Data: Contains Yunnan Aluminium’s historical financial statements and projections.
- Discounted Cash Flow Model: An editable DCF valuation model featuring automatic calculations.
- Weighted Average Cost of Capital (WACC): A dedicated sheet for determining WACC based on customizable inputs.
- Key Financial Ratios: Assess Yunnan Aluminium’s profitability, operational efficiency, and financial leverage.
- Customizable Inputs: Easily modify assumptions for revenue growth, profit margins, and tax rates.
- Clear Dashboard: Visual charts and tables that summarize essential valuation outcomes.
Disclaimer
All information, articles, and product details provided on this website are for general informational and educational purposes only. We do not claim any ownership over, nor do we intend to infringe upon, any trademarks, copyrights, logos, brand names, or other intellectual property mentioned or depicted on this site. Such intellectual property remains the property of its respective owners, and any references here are made solely for identification or informational purposes, without implying any affiliation, endorsement, or partnership.
We make no representations or warranties, express or implied, regarding the accuracy, completeness, or suitability of any content or products presented. Nothing on this website should be construed as legal, tax, investment, financial, medical, or other professional advice. In addition, no part of this site—including articles or product references—constitutes a solicitation, recommendation, endorsement, advertisement, or offer to buy or sell any securities, franchises, or other financial instruments, particularly in jurisdictions where such activity would be unlawful.
All content is of a general nature and may not address the specific circumstances of any individual or entity. It is not a substitute for professional advice or services. Any actions you take based on the information provided here are strictly at your own risk. You accept full responsibility for any decisions or outcomes arising from your use of this website and agree to release us from any liability in connection with your use of, or reliance upon, the content or products found herein.