
|
J.S. Corrunging Machinery Co., Ltd. (000821.SZ) Valation DCF |
Entièrement Modifiable: Adapté À Vos Besoins Dans Excel Ou Sheets
Conception Professionnelle: Modèles Fiables Et Conformes Aux Normes Du Secteur
Pré-Construits Pour Une Utilisation Rapide Et Efficace
Compatible MAC/PC, entièrement débloqué
Aucune Expertise N'Est Requise; Facile À Suivre
J.S. Corrugating Machinery Co., Ltd. (000821.SZ) Bundle
Découvrez le véritable potentiel de J.S. Corrugrating Machinery Co., Ltd. (000821SZ) avec notre calculatrice avancée DCF! Ajustez les hypothèses critiques, explorez divers scénarios et évaluez comment les fluctuations influencent l'évaluation de J.S. Corrugrating Machinery Co., Ltd. (000821SZ) - le tout dans un modèle Excel complet.
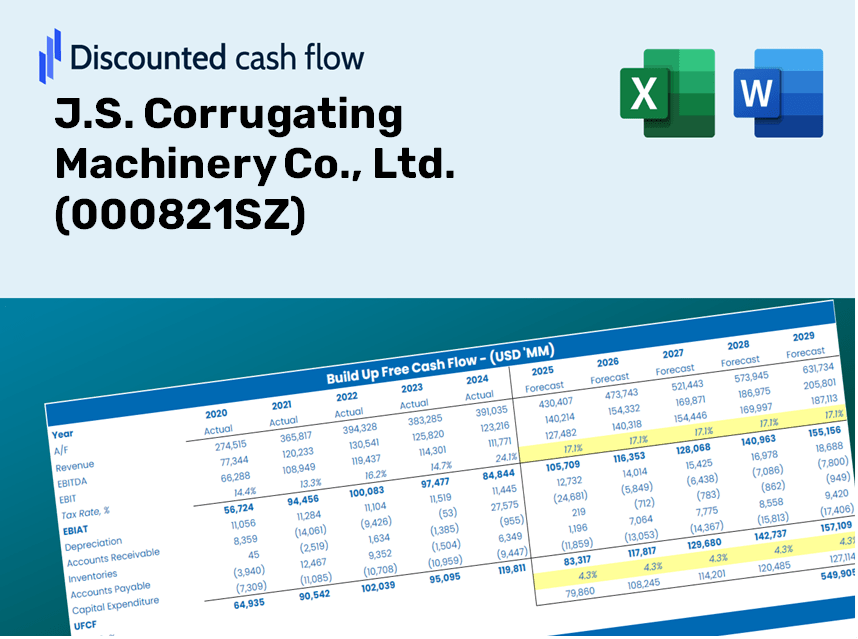
Discounted Cash Flow (DCF) - (USD MM)
| Year | AY1 2020 |
AY2 2021 |
AY3 2022 |
AY4 2023 |
AY5 2024 |
FY1 2025 |
FY2 2026 |
FY3 2027 |
FY4 2028 |
FY5 2029 |
|---|---|---|---|---|---|---|---|---|---|---|
| Revenue | 3,059.9 | 4,085.7 | 4,867.7 | 7,213.8 | 8,722.9 | 9,178.3 | 9,657.6 | 10,161.8 | 10,692.4 | 11,250.7 |
| Revenue Growth, % | 0 | 33.52 | 19.14 | 48.2 | 20.92 | 5.22 | 5.22 | 5.22 | 5.22 | 5.22 |
| EBITDA | 157.0 | 252.5 | 388.0 | 501.0 | 470.0 | 580.3 | 610.6 | 642.5 | 676.0 | 711.3 |
| EBITDA, % | 5.13 | 6.18 | 7.97 | 6.95 | 5.39 | 6.32 | 6.32 | 6.32 | 6.32 | 6.32 |
| Depreciation | 72.8 | 84.8 | 68.0 | 74.7 | 97.3 | 146.9 | 154.6 | 162.7 | 171.2 | 180.1 |
| Depreciation, % | 2.38 | 2.08 | 1.4 | 1.04 | 1.12 | 1.6 | 1.6 | 1.6 | 1.6 | 1.6 |
| EBIT | 84.1 | 167.7 | 320.0 | 426.3 | 372.7 | 433.4 | 456.0 | 479.8 | 504.9 | 531.2 |
| EBIT, % | 2.75 | 4.1 | 6.57 | 5.91 | 4.27 | 4.72 | 4.72 | 4.72 | 4.72 | 4.72 |
| Total Cash | 685.8 | 1,564.6 | 1,619.0 | 2,840.4 | 2,563.8 | 2,987.2 | 3,143.2 | 3,307.3 | 3,480.0 | 3,661.7 |
| Total Cash, percent | .0 | .0 | .0 | .0 | .0 | .0 | .0 | .0 | .0 | .0 |
| Account Receivables | 1,601.0 | 1,652.3 | 2,078.3 | 3,398.5 | 3,947.2 | 4,182.1 | 4,400.5 | 4,630.2 | 4,872.0 | 5,126.4 |
| Account Receivables, % | 52.32 | 40.44 | 42.7 | 47.11 | 45.25 | 45.56 | 45.56 | 45.56 | 45.56 | 45.56 |
| Inventories | 1,994.6 | 2,517.1 | 3,731.6 | 7,125.3 | 4,830.9 | 6,564.5 | 6,907.2 | 7,267.9 | 7,647.4 | 8,046.7 |
| Inventories, % | 65.19 | 61.61 | 76.66 | 98.77 | 55.38 | 71.52 | 71.52 | 71.52 | 71.52 | 71.52 |
| Accounts Payable | 1,802.8 | 2,491.9 | 3,688.2 | 6,537.8 | 5,598.6 | 6,433.8 | 6,769.8 | 7,123.2 | 7,495.2 | 7,886.5 |
| Accounts Payable, % | 58.92 | 60.99 | 75.77 | 90.63 | 64.18 | 70.1 | 70.1 | 70.1 | 70.1 | 70.1 |
| Capital Expenditure | -74.2 | -135.8 | -386.9 | -215.4 | -231.6 | -355.0 | -373.5 | -393.0 | -413.5 | -435.1 |
| Capital Expenditure, % | -2.42 | -3.32 | -7.95 | -2.99 | -2.65 | -3.87 | -3.87 | -3.87 | -3.87 | -3.87 |
| Tax Rate, % | 19.22 | 19.22 | 19.22 | 19.22 | 19.22 | 19.22 | 19.22 | 19.22 | 19.22 | 19.22 |
| EBITAT | 121.5 | 180.6 | 256.6 | 328.6 | 301.1 | 379.7 | 399.5 | 420.4 | 442.3 | 465.4 |
| Depreciation | ||||||||||
| Changes in Account Receivables | ||||||||||
| Changes in Inventories | ||||||||||
| Changes in Accounts Payable | ||||||||||
| Capital Expenditure | ||||||||||
| UFCF | -1,672.8 | 245.0 | -506.5 | -1,676.5 | 973.5 | -961.7 | -44.6 | -46.9 | -49.4 | -51.9 |
| WACC, % | 4.64 | 4.64 | 4.53 | 4.51 | 4.53 | 4.57 | 4.57 | 4.57 | 4.57 | 4.57 |
| PV UFCF | ||||||||||
| SUM PV UFCF | -1,084.3 | |||||||||
| Long Term Growth Rate, % | 3.50 | |||||||||
| Free cash flow (T + 1) | -54 | |||||||||
| Terminal Value | -5,038 | |||||||||
| Present Terminal Value | -4,030 | |||||||||
| Enterprise Value | -5,114 | |||||||||
| Net Debt | -1,172 | |||||||||
| Equity Value | -3,942 | |||||||||
| Diluted Shares Outstanding, MM | 621 | |||||||||
| Equity Value Per Share | -6.34 |
What You Will Gain
- Genuine J.S. Corrugating Data: Preloaded financial metrics – encompassing revenue to EBIT – based on real and projected values.
- Complete Customization: Alter all essential parameters (yellow cells) such as WACC, growth %, and tax rates.
- Immediate Valuation Updates: Automatic recalculations to assess the effects of modifications on J.S. Corrugating's fair value.
- Flexible Excel Template: Designed for quick edits, scenario analysis, and comprehensive projections.
- Efficient and Precise: Avoid starting from scratch while ensuring accuracy and adaptability.
Key Features
- 🔍 Real-Time J.S. Corrugating Financials: Pre-filled historical and projected data for J.S. Corrugating Machinery Co., Ltd. (000821SZ).
- ✏️ Fully Customizable Inputs: Modify all essential parameters (highlighted cells) such as WACC, growth %, and tax rates.
- 📊 Comprehensive DCF Valuation: Integrated formulas compute J.S. Corrugating’s intrinsic value using the Discounted Cash Flow approach.
- ⚡ Instantaneous Results: View J.S. Corrugating’s valuation immediately after adjustments.
- Scenario Analysis: Evaluate and contrast outcomes based on different financial assumptions side-by-side.
How It Works
- Download: Obtain the pre-formatted Excel file containing J.S. Corrugating Machinery Co., Ltd.'s (000821SZ) financial data.
- Customize: Modify projections such as revenue growth, EBITDA %, and WACC to fit your analysis.
- Update Automatically: Watch as intrinsic value and NPV calculations refresh in real-time.
- Test Scenarios: Generate various projections and swiftly compare the results.
- Make Decisions: Leverage the valuation insights to inform your investment approach.
Why Opt for J.S. Corrugating Machinery's Calculator?
- All-in-One Solution: Features DCF, WACC, and financial ratio analysis seamlessly integrated.
- Flexible Inputs: Modify the highlighted cells to explore different financial scenarios.
- In-Depth Analysis: Automatically computes the intrinsic value and Net Present Value for J.S. Corrugating Machinery (000821SZ).
- Data Ready: Comes with historical and projected data for reliable calculations.
- Expert-Level Quality: Perfect for financial analysts, investors, and business advisors.
Who Can Benefit from Our Machinery?
- Manufacturers: Optimize production processes with state-of-the-art corrugating machinery.
- Engineering Teams: Evaluate equipment performance to enhance project efficiency.
- Consultants and Advisors: Offer clients expert insights into the corrugating industry's best practices.
- Students and Educators: Gain hands-on experience and knowledge in industrial machinery applications.
- Industry Enthusiasts: Discover how machinery like that from J.S. Corrugating Machinery Co., Ltd. (000821SZ) shapes the manufacturing landscape.
Contents of the Template
- Pre-Filled Data: Contains historical financials and projections for J.S. Corrugating Machinery Co., Ltd. (000821SZ).
- Discounted Cash Flow Model: An editable DCF valuation model featuring automatic calculations.
- Weighted Average Cost of Capital (WACC): A specific sheet for calculating WACC with customizable inputs.
- Key Financial Ratios: Evaluate J.S. Corrugating Machinery Co., Ltd.'s profitability, efficiency, and leverage.
- Customizable Inputs: Easily modify revenue growth, profit margins, and tax rates.
- Clear Dashboard: Visual representations and tables summarizing key valuation outcomes.
Disclaimer
All information, articles, and product details provided on this website are for general informational and educational purposes only. We do not claim any ownership over, nor do we intend to infringe upon, any trademarks, copyrights, logos, brand names, or other intellectual property mentioned or depicted on this site. Such intellectual property remains the property of its respective owners, and any references here are made solely for identification or informational purposes, without implying any affiliation, endorsement, or partnership.
We make no representations or warranties, express or implied, regarding the accuracy, completeness, or suitability of any content or products presented. Nothing on this website should be construed as legal, tax, investment, financial, medical, or other professional advice. In addition, no part of this site—including articles or product references—constitutes a solicitation, recommendation, endorsement, advertisement, or offer to buy or sell any securities, franchises, or other financial instruments, particularly in jurisdictions where such activity would be unlawful.
All content is of a general nature and may not address the specific circumstances of any individual or entity. It is not a substitute for professional advice or services. Any actions you take based on the information provided here are strictly at your own risk. You accept full responsibility for any decisions or outcomes arising from your use of this website and agree to release us from any liability in connection with your use of, or reliance upon, the content or products found herein.