
|
Shanxi Taigang Inoxydnus Steel Co., Ltd. (000825.SZ) Valation DCF |
Entièrement Modifiable: Adapté À Vos Besoins Dans Excel Ou Sheets
Conception Professionnelle: Modèles Fiables Et Conformes Aux Normes Du Secteur
Pré-Construits Pour Une Utilisation Rapide Et Efficace
Compatible MAC/PC, entièrement débloqué
Aucune Expertise N'Est Requise; Facile À Suivre
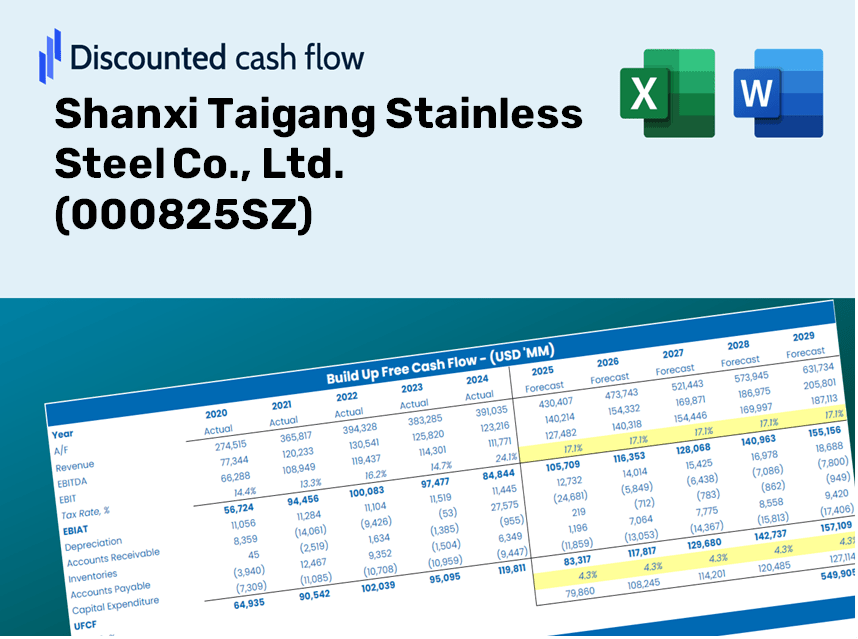
Shanxi Taigang Stainless Steel Co., Ltd. (000825.SZ) Bundle
Conçu pour la précision, notre (000825SZ) la calculatrice DCF vous permet d'évaluer l'évaluation de Shanxi Taigang Inoxydnus Steel Co., Ltd. à l'aide de données financières réelles, offrant une flexibilité complète pour modifier tous les paramètres clés pour des projections améliorées.
Discounted Cash Flow (DCF) - (USD MM)
| Year | AY1 2020 |
AY2 2021 |
AY3 2022 |
AY4 2023 |
AY5 2024 |
FY1 2025 |
FY2 2026 |
FY3 2027 |
FY4 2028 |
FY5 2029 |
|---|---|---|---|---|---|---|---|---|---|---|
| Revenue | 67,419.4 | 101,437.3 | 97,654.4 | 105,617.8 | 100,379.5 | 96,537.0 | 92,841.6 | 89,287.7 | 85,869.8 | 82,582.8 |
| Revenue Growth, % | 0 | 50.46 | -3.73 | 8.15 | -4.96 | -3.83 | -3.83 | -3.83 | -3.83 | -3.83 |
| EBITDA | 5,438.7 | 11,152.5 | 3,347.1 | 1,256.4 | 2,017.1 | 4,959.7 | 4,769.8 | 4,587.2 | 4,411.6 | 4,242.8 |
| EBITDA, % | 8.07 | 10.99 | 3.43 | 1.19 | 2.01 | 5.14 | 5.14 | 5.14 | 5.14 | 5.14 |
| Depreciation | 3,195.7 | 3,182.7 | 3,099.7 | 3,123.6 | 3,222.5 | 3,324.7 | 3,197.4 | 3,075.0 | 2,957.3 | 2,844.1 |
| Depreciation, % | 4.74 | 3.14 | 3.17 | 2.96 | 3.21 | 3.44 | 3.44 | 3.44 | 3.44 | 3.44 |
| EBIT | 2,242.9 | 7,969.8 | 247.4 | -1,867.2 | -1,205.4 | 1,635.0 | 1,572.4 | 1,512.2 | 1,454.3 | 1,398.7 |
| EBIT, % | 3.33 | 7.86 | 0.2533 | -1.77 | -1.2 | 1.69 | 1.69 | 1.69 | 1.69 | 1.69 |
| Total Cash | 9,521.7 | 9,324.2 | 11,069.3 | 8,357.9 | 8,144.9 | 9,784.6 | 9,410.0 | 9,049.8 | 8,703.4 | 8,370.2 |
| Total Cash, percent | .0 | .0 | .0 | .0 | .0 | .0 | .0 | .0 | .0 | .0 |
| Account Receivables | 2,899.1 | 1,558.0 | 2,206.5 | 2,747.7 | 2,235.3 | 2,495.3 | 2,399.8 | 2,307.9 | 2,219.5 | 2,134.6 |
| Account Receivables, % | 4.3 | 1.54 | 2.26 | 2.6 | 2.23 | 2.58 | 2.58 | 2.58 | 2.58 | 2.58 |
| Inventories | 8,838.8 | 10,008.3 | 9,764.3 | 8,436.7 | 9,645.5 | 9,764.2 | 9,390.4 | 9,031.0 | 8,685.3 | 8,352.8 |
| Inventories, % | 13.11 | 9.87 | 10 | 7.99 | 9.61 | 10.11 | 10.11 | 10.11 | 10.11 | 10.11 |
| Accounts Payable | 10,553.4 | 14,447.2 | 16,119.5 | 8,146.1 | 18,515.6 | 14,009.6 | 13,473.4 | 12,957.6 | 12,461.6 | 11,984.6 |
| Accounts Payable, % | 15.65 | 14.24 | 16.51 | 7.71 | 18.45 | 14.51 | 14.51 | 14.51 | 14.51 | 14.51 |
| Capital Expenditure | -2,312.6 | -2,683.5 | -3,642.5 | -3,356.6 | -2,403.0 | -2,969.0 | -2,855.3 | -2,746.0 | -2,640.9 | -2,539.8 |
| Capital Expenditure, % | -3.43 | -2.65 | -3.73 | -3.18 | -2.39 | -3.08 | -3.08 | -3.08 | -3.08 | -3.08 |
| Tax Rate, % | -4.66 | -4.66 | -4.66 | -4.66 | -4.66 | -4.66 | -4.66 | -4.66 | -4.66 | -4.66 |
| EBITAT | 2,250.4 | 7,344.4 | 181.5 | -1,677.4 | -1,261.6 | 1,489.0 | 1,432.0 | 1,377.2 | 1,324.5 | 1,273.8 |
| Depreciation | ||||||||||
| Changes in Account Receivables | ||||||||||
| Changes in Inventories | ||||||||||
| Changes in Accounts Payable | ||||||||||
| Capital Expenditure | ||||||||||
| UFCF | 1,949.1 | 11,909.0 | 906.7 | -9,097.5 | 9,231.0 | -3,040.0 | 1,707.1 | 1,641.7 | 1,578.9 | 1,518.5 |
| WACC, % | 5.57 | 5.51 | 5.36 | 5.49 | 5.57 | 5.5 | 5.5 | 5.5 | 5.5 | 5.5 |
| PV UFCF | ||||||||||
| SUM PV UFCF | 2,486.7 | |||||||||
| Long Term Growth Rate, % | 2.00 | |||||||||
| Free cash flow (T + 1) | 1,549 | |||||||||
| Terminal Value | 44,252 | |||||||||
| Present Terminal Value | 33,859 | |||||||||
| Enterprise Value | 36,346 | |||||||||
| Net Debt | -3,559 | |||||||||
| Equity Value | 39,905 | |||||||||
| Diluted Shares Outstanding, MM | 5,704 | |||||||||
| Equity Value Per Share | 7.00 |
Benefits You Will Receive
- Customizable Excel Template: A fully adaptable Excel-based DCF Calculator featuring pre-loaded financial data for Shanxi Taigang Stainless Steel Co., Ltd. (000825SZ).
- Authentic Data: Access to historical financial figures and projected estimates (highlighted in the yellow cells).
- Flexible Forecasts: Adjust key assumptions such as revenue growth, EBITDA margin, and WACC.
- Instant Calculations: Quickly observe how your inputs influence the valuation of Shanxi Taigang Stainless Steel Co., Ltd. (000825SZ).
- Professional-Grade Tool: Designed for investors, CFOs, consultants, and financial analysts.
- User-Friendly Layout: Organized for ease of navigation, complete with step-by-step guidance.
Key Features
- 🔍 Real-Life TISCO Financials: Pre-filled historical and projected data for Shanxi Taigang Stainless Steel Co., Ltd. (000825SZ).
- ✏️ Fully Customizable Inputs: Modify all essential parameters (yellow cells) like WACC, growth %, and tax rates.
- 📊 Professional DCF Valuation: Integrated formulas compute TISCO’s intrinsic value using the Discounted Cash Flow method.
- ⚡ Instant Results: View TISCO’s valuation immediately after making adjustments.
- Scenario Analysis: Evaluate and compare outcomes for different financial assumptions side-by-side.
How It Functions
- Download: Get the pre-prepared Excel file containing the financial data for Shanxi Taigang Stainless Steel Co., Ltd. (000825SZ).
- Customize: Modify forecasts such as revenue growth, EBITDA percentage, and WACC to suit your analysis.
- Update Instantly: The intrinsic value and NPV calculations refresh in real-time as you make changes.
- Evaluate Scenarios: Generate various projections and analyze the results immediately.
- Make Informed Decisions: Leverage the valuation findings to shape your investment approach.
Why Opt for This Calculator?
- Precise Information: Authentic financial data from Shanxi Taigang Stainless Steel Co., Ltd. guarantees dependable valuation outcomes.
- Flexible Settings: Tailor essential variables such as growth rates, WACC, and tax rates to fit your forecasts.
- Efficiency Boost: Pre-configured calculations save you the hassle of starting from the ground up.
- Industry-Grade Tool: Crafted for investors, analysts, and consultants alike.
- Easy to Navigate: User-friendly design and clear, step-by-step guidance make it accessible for everyone.
Who Can Benefit from This Product?
- Finance Students: Gain expertise in valuation methods and practice with actual market data for Shanxi Taigang Stainless Steel Co., Ltd. (000825SZ).
- Academics: Utilize industry-standard models for your coursework or research related to Shanxi Taigang Stainless Steel Co., Ltd. (000825SZ).
- Investors: Validate your investment hypotheses and assess valuation metrics for Shanxi Taigang Stainless Steel Co., Ltd. (000825SZ).
- Analysts: Enhance efficiency with a customizable DCF model specifically designed for Shanxi Taigang Stainless Steel Co., Ltd. (000825SZ).
- Small Business Owners: Learn from the analytical approaches applied to large public companies like Shanxi Taigang Stainless Steel Co., Ltd. (000825SZ).
Contents of the Template
- Historical Data: Contains past financial performance and baseline projections for Shanxi Taigang Stainless Steel Co., Ltd. (000825SZ).
- DCF and Levered DCF Models: Comprehensive templates designed to assess the intrinsic value of Shanxi Taigang Stainless Steel Co., Ltd. (000825SZ).
- WACC Sheet: Preconfigured calculations for the Weighted Average Cost of Capital.
- Editable Inputs: Customize essential factors such as growth rates, EBITDA margins, and CAPEX assumptions.
- Quarterly and Annual Statements: A thorough analysis of the financial statements of Shanxi Taigang Stainless Steel Co., Ltd. (000825SZ).
- Interactive Dashboard: Dynamically visualize valuation outcomes and future projections.
Disclaimer
All information, articles, and product details provided on this website are for general informational and educational purposes only. We do not claim any ownership over, nor do we intend to infringe upon, any trademarks, copyrights, logos, brand names, or other intellectual property mentioned or depicted on this site. Such intellectual property remains the property of its respective owners, and any references here are made solely for identification or informational purposes, without implying any affiliation, endorsement, or partnership.
We make no representations or warranties, express or implied, regarding the accuracy, completeness, or suitability of any content or products presented. Nothing on this website should be construed as legal, tax, investment, financial, medical, or other professional advice. In addition, no part of this site—including articles or product references—constitutes a solicitation, recommendation, endorsement, advertisement, or offer to buy or sell any securities, franchises, or other financial instruments, particularly in jurisdictions where such activity would be unlawful.
All content is of a general nature and may not address the specific circumstances of any individual or entity. It is not a substitute for professional advice or services. Any actions you take based on the information provided here are strictly at your own risk. You accept full responsibility for any decisions or outcomes arising from your use of this website and agree to release us from any liability in connection with your use of, or reliance upon, the content or products found herein.