
|
Cheng de Lolo Company Limited (000848.sz) Valation DCF |
Entièrement Modifiable: Adapté À Vos Besoins Dans Excel Ou Sheets
Conception Professionnelle: Modèles Fiables Et Conformes Aux Normes Du Secteur
Pré-Construits Pour Une Utilisation Rapide Et Efficace
Compatible MAC/PC, entièrement débloqué
Aucune Expertise N'Est Requise; Facile À Suivre
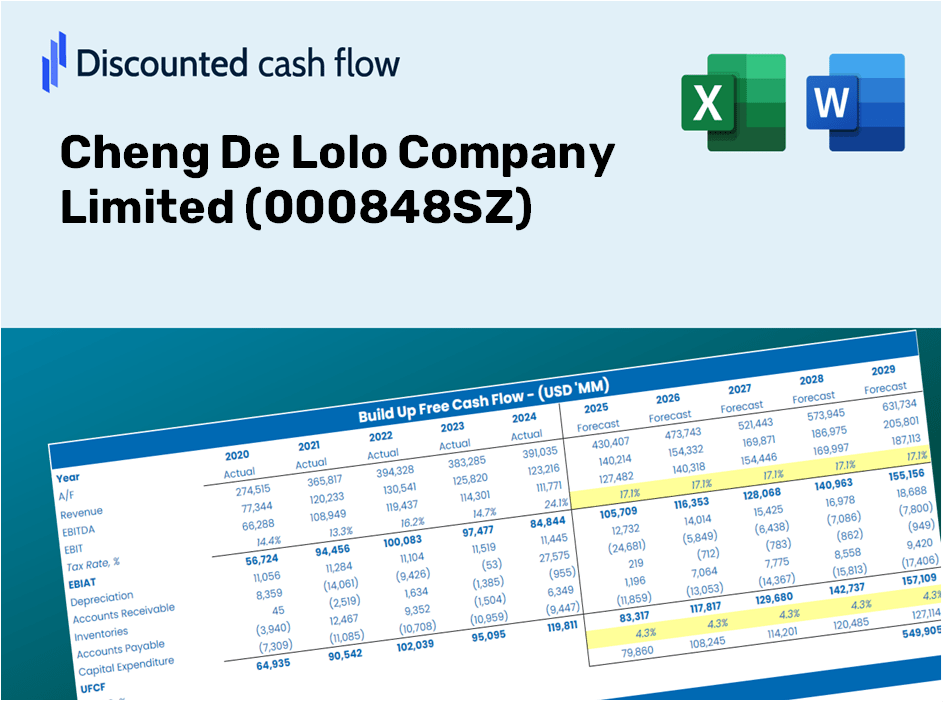
Cheng De Lolo Company Limited (000848.SZ) Bundle
Que vous soyez un investisseur ou un analyste, cette calculatrice DCF (000848SZ) est votre ressource incontournable pour une évaluation précise. Équipé de données réelles de Cheng de Lolo Company Limited, vous pouvez ajuster les prévisions et observer les effets en temps réel.
What You Will Receive
- Genuine Cheng De Lolo Data: Comprehensive financials – from revenue to EBIT – based on historical and projected information.
- Complete Customization: Modify all essential parameters (highlighted cells) such as WACC, growth %, and tax rates.
- Immediate Valuation Adjustments: Automatic recalculations to assess the effects of changes on Cheng De Lolo's fair value.
- Flexible Excel Template: Designed for easy adjustments, scenario analysis, and in-depth forecasts.
- Efficient and Precise: Eliminate the need to build models from scratch while ensuring accuracy and adaptability.
Key Features
- Actual Financial Data for Cheng De Lolo: Filled with historical financial figures and future projections for Cheng De Lolo Company Limited (000848SZ).
- Customizable Parameters: Modify inputs such as revenue growth, profit margins, WACC, tax rates, and capital expenditures.
- Interactive Valuation Model: Automatic recalculations of Net Present Value (NPV) and intrinsic value based on user-defined inputs.
- Scenario Analysis: Generate various forecasting scenarios to explore different valuation results.
- User-Friendly Interface: Intuitive design that caters to both seasoned professionals and newcomers.
How It Functions
- 1. Access the Template: Download and open the Excel file containing preloaded data for Cheng De Lolo Company Limited (000848SZ).
- 2. Modify Assumptions: Adjust crucial inputs such as growth projections, WACC, and capital expenditure figures.
- 3. See Results in Real-Time: The DCF model automatically computes intrinsic value and NPV as you make changes.
- 4. Evaluate Scenarios: Analyze various forecasts to explore different valuation possibilities.
- 5. Present with Assurance: Deliver professional valuation insights to inform your strategic decisions.
Why Opt for This Calculator?
- Designed for Experts: A sophisticated tool tailored for analysts, CFOs, and advisors.
- Up-to-Date Information: Historical and projected financial data for Cheng De Lolo Company Limited (000848SZ) preloaded for precise analysis.
- Comprehensive Scenario Modeling: Effortlessly test various forecasts and assumptions.
- Transparent Results: Automatically computes intrinsic value, NPV, and essential metrics.
- User-Friendly Interface: Step-by-step guidance to assist you throughout the calculation process.
Who Can Benefit from This Product?
- Investors: Evaluate Cheng De Lolo Company Limited's (000848SZ) valuation prior to making investment decisions.
- CFOs and Financial Analysts: Enhance efficiency in valuation processes and validate financial projections.
- Startup Founders: Understand how established companies like Cheng De Lolo Company Limited (000848SZ) are appraised.
- Consultants: Create comprehensive valuation reports for clients centered around Cheng De Lolo Company Limited (000848SZ).
- Students and Educators: Utilize real-time data to practice and instruct on valuation methodologies.
Contents of the Template
- Pre-Filled DCF Model: Cheng De Lolo Company Limited’s financial data preloaded for immediate utilization.
- WACC Calculator: Comprehensive calculations for the Weighted Average Cost of Capital.
- Financial Ratios: Assess Cheng De Lolo's profitability, leverage, and operational efficiency.
- Editable Inputs: Modify assumptions such as growth rates, profit margins, and capital expenditures to suit your scenarios.
- Financial Statements: Access annual and quarterly reports for in-depth analysis.
- Interactive Dashboard: Effortlessly visualize essential valuation metrics and outcomes.
Disclaimer
All information, articles, and product details provided on this website are for general informational and educational purposes only. We do not claim any ownership over, nor do we intend to infringe upon, any trademarks, copyrights, logos, brand names, or other intellectual property mentioned or depicted on this site. Such intellectual property remains the property of its respective owners, and any references here are made solely for identification or informational purposes, without implying any affiliation, endorsement, or partnership.
We make no representations or warranties, express or implied, regarding the accuracy, completeness, or suitability of any content or products presented. Nothing on this website should be construed as legal, tax, investment, financial, medical, or other professional advice. In addition, no part of this site—including articles or product references—constitutes a solicitation, recommendation, endorsement, advertisement, or offer to buy or sell any securities, franchises, or other financial instruments, particularly in jurisdictions where such activity would be unlawful.
All content is of a general nature and may not address the specific circumstances of any individual or entity. It is not a substitute for professional advice or services. Any actions you take based on the information provided here are strictly at your own risk. You accept full responsibility for any decisions or outcomes arising from your use of this website and agree to release us from any liability in connection with your use of, or reliance upon, the content or products found herein.