
|
CGN Nuclear Technology Development Co., Ltd. (000881.SZ) Évaluation DCF |
Entièrement Modifiable: Adapté À Vos Besoins Dans Excel Ou Sheets
Conception Professionnelle: Modèles Fiables Et Conformes Aux Normes Du Secteur
Pré-Construits Pour Une Utilisation Rapide Et Efficace
Compatible MAC/PC, entièrement débloqué
Aucune Expertise N'Est Requise; Facile À Suivre
CGN Nuclear Technology Development Co., Ltd. (000881.SZ) Bundle
Explorez les perspectives financières de CGN Nuclear Technology Development Co., Ltd. (000881SZ) avec notre calculatrice DCF conviviale! Entrez simplement vos hypothèses concernant la croissance, les marges et les coûts pour déterminer la valeur intrinsèque de CGN Nuclear Technology Development Co., Ltd. (000881SZ) et améliorez votre stratégie d'investissement.
Discounted Cash Flow (DCF) - (USD MM)
| Year | AY1 2020 |
AY2 2021 |
AY3 2022 |
AY4 2023 |
AY5 2024 |
FY1 2025 |
FY2 2026 |
FY3 2027 |
FY4 2028 |
FY5 2029 |
|---|---|---|---|---|---|---|---|---|---|---|
| Revenue | 6,651.7 | 7,998.9 | 6,944.9 | 6,352.5 | 6,168.4 | 6,101.3 | 6,034.9 | 5,969.3 | 5,904.3 | 5,840.1 |
| Revenue Growth, % | 0 | 20.25 | -13.18 | -8.53 | -2.9 | -1.09 | -1.09 | -1.09 | -1.09 | -1.09 |
| EBITDA | 732.3 | 849.6 | 1,092.8 | -52.7 | 146.7 | 474.9 | 469.7 | 464.6 | 459.5 | 454.5 |
| EBITDA, % | 11.01 | 10.62 | 15.73 | -0.82929 | 2.38 | 7.78 | 7.78 | 7.78 | 7.78 | 7.78 |
| Depreciation | 257.5 | 338.1 | 511.1 | 511.8 | 382.0 | 362.5 | 358.6 | 354.7 | 350.8 | 347.0 |
| Depreciation, % | 3.87 | 4.23 | 7.36 | 8.06 | 6.19 | 5.94 | 5.94 | 5.94 | 5.94 | 5.94 |
| EBIT | 474.8 | 511.5 | 581.7 | -564.5 | -235.3 | 112.4 | 111.1 | 109.9 | 108.7 | 107.5 |
| EBIT, % | 7.14 | 6.39 | 8.38 | -8.89 | -3.81 | 1.84 | 1.84 | 1.84 | 1.84 | 1.84 |
| Total Cash | 2,397.7 | 2,180.6 | 1,945.6 | 1,335.2 | 1,490.8 | 1,665.8 | 1,647.7 | 1,629.7 | 1,612.0 | 1,594.5 |
| Total Cash, percent | .0 | .0 | .0 | .0 | .0 | .0 | .0 | .0 | .0 | .0 |
| Account Receivables | 3,308.9 | 3,637.2 | 3,194.9 | 3,562.7 | 3,349.0 | 3,070.1 | 3,036.7 | 3,003.7 | 2,971.0 | 2,938.7 |
| Account Receivables, % | 49.75 | 45.47 | 46 | 56.08 | 54.29 | 50.32 | 50.32 | 50.32 | 50.32 | 50.32 |
| Inventories | 1,529.4 | 1,843.4 | 1,242.1 | 1,064.1 | 1,077.5 | 1,197.6 | 1,184.6 | 1,171.7 | 1,158.9 | 1,146.3 |
| Inventories, % | 22.99 | 23.05 | 17.89 | 16.75 | 17.47 | 19.63 | 19.63 | 19.63 | 19.63 | 19.63 |
| Accounts Payable | 1,344.2 | 1,610.9 | 609.3 | 711.7 | 1,288.5 | 991.0 | 980.2 | 969.5 | 959.0 | 948.6 |
| Accounts Payable, % | 20.21 | 20.14 | 8.77 | 11.2 | 20.89 | 16.24 | 16.24 | 16.24 | 16.24 | 16.24 |
| Capital Expenditure | -797.1 | -556.3 | -278.5 | -440.4 | -543.9 | -472.2 | -467.1 | -462.0 | -457.0 | -452.0 |
| Capital Expenditure, % | -11.98 | -6.96 | -4.01 | -6.93 | -8.82 | -7.74 | -7.74 | -7.74 | -7.74 | -7.74 |
| Tax Rate, % | -7.71 | -7.71 | -7.71 | -7.71 | -7.71 | -7.71 | -7.71 | -7.71 | -7.71 | -7.71 |
| EBITAT | 380.8 | 558.7 | 537.3 | -618.6 | -253.4 | 106.2 | 105.0 | 103.9 | 102.8 | 101.6 |
| Depreciation | ||||||||||
| Changes in Account Receivables | ||||||||||
| Changes in Inventories | ||||||||||
| Changes in Accounts Payable | ||||||||||
| Capital Expenditure | ||||||||||
| UFCF | -3,652.9 | -35.1 | 811.9 | -634.6 | 361.6 | -142.2 | 32.1 | 31.8 | 31.4 | 31.1 |
| WACC, % | 5.12 | 5.33 | 5.25 | 5.33 | 5.33 | 5.27 | 5.27 | 5.27 | 5.27 | 5.27 |
| PV UFCF | ||||||||||
| SUM PV UFCF | -29.2 | |||||||||
| Long Term Growth Rate, % | 2.00 | |||||||||
| Free cash flow (T + 1) | 32 | |||||||||
| Terminal Value | 970 | |||||||||
| Present Terminal Value | 750 | |||||||||
| Enterprise Value | 721 | |||||||||
| Net Debt | 1,528 | |||||||||
| Equity Value | -807 | |||||||||
| Diluted Shares Outstanding, MM | 945 | |||||||||
| Equity Value Per Share | -0.85 |
What You Will Receive
- Customizable Excel Template: A fully adjustable Excel-based DCF Calculator featuring pre-filled financial data for CGN Nuclear Technology Development Co., Ltd. (000881SZ).
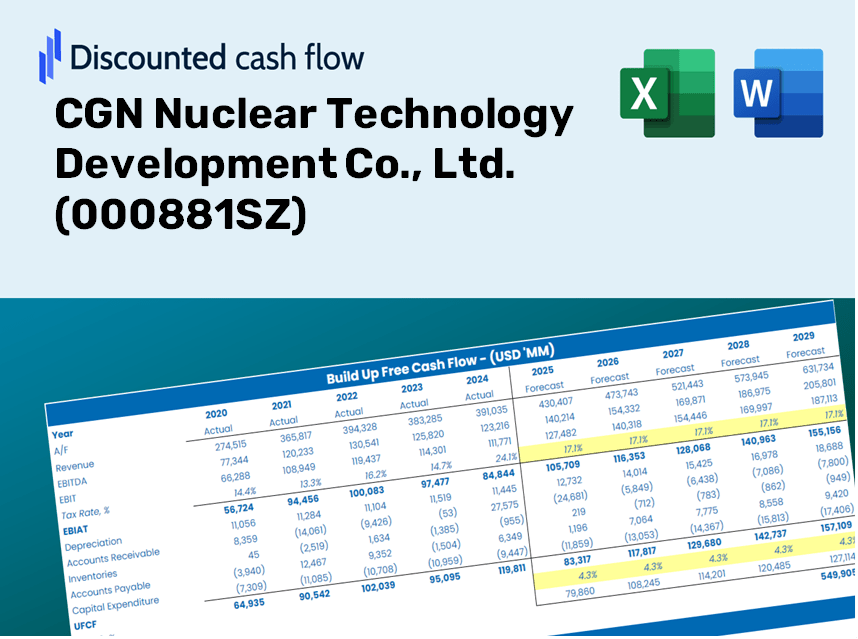
- Accurate Historical Data: Access to historical performance metrics and forward-looking projections (highlighted in the yellow cells).
- Flexible Forecasting: Adjust key assumptions such as revenue growth, EBITDA margins, and WACC.
- Instant Calculations: Quickly assess how your inputs affect the valuation of CGN Nuclear Technology Development Co., Ltd. (000881SZ).
- Professional Resource: Designed for investors, finance executives, consultants, and analysts.
- Intuitive Layout: Organized for simplicity and usability, featuring comprehensive step-by-step guidance.
Key Features
- Customizable Forecast Inputs: Adjust essential factors such as revenue growth, EBITDA margin, and capital investments.
- Instant DCF Valuation: Automatically computes intrinsic value, NPV, and additional metrics without delay.
- High Precision Accuracy: Leverages CGN Nuclear Technology Development Co., Ltd.'s financial data for reliable valuation results.
- Effortless Scenario Analysis: Easily explore various assumptions and evaluate different outcomes.
- Efficiency Booster: Avoid the hassles of constructing intricate valuation models from the ground up.
How It Works
- 1. Access the Template: Download and open the Excel file containing CGN Nuclear Technology Development Co., Ltd.'s preloaded data.
- 2. Modify Inputs: Adjust essential parameters such as growth rates, WACC, and capital expenditures.
- 3. See Instant Results: The DCF model automatically calculates intrinsic value and NPV in real-time.
- 4. Explore Scenarios: Evaluate various forecasts to assess different valuation possibilities.
- 5. Present with Confidence: Deliver professional valuation insights to support your strategic decisions for CGN Nuclear Technology Development Co., Ltd. (000881SZ).
Why Choose This Calculator for CGN Nuclear Technology Development Co., Ltd. (000881SZ)?
- All-in-One Solution: Combines DCF, WACC, and financial ratio analyses for comprehensive evaluations.
- Flexible Input Options: Modify the yellow-highlighted fields to explore different financial scenarios.
- In-Depth Analysis: Automatically computes the intrinsic value and Net Present Value for CGN.
- Rich Data Set: Comes with historical and projected data to provide a solid foundation for analysis.
- High-Caliber Tool: Perfect for financial analysts, investors, and business consultants focused on CGN.
Who Can Benefit from This Product?
- Nuclear Engineering Students: Master technical analysis and apply methods to real-world scenarios.
- Researchers: Integrate industry-standard models into your academic projects or studies.
- Investors: Validate your investment strategies and evaluate performance metrics for CGN Nuclear Technology Development Co., Ltd. (000881SZ).
- Market Analysts: Enhance your productivity with a customizable framework tailored for DCF analysis.
- Small Business Innovators: Understand the analytical approaches taken by major companies in the nuclear sector.
Contents of the Template
- Preloaded CGN Data: Historical and forecasted financial metrics, including revenue, EBIT, and capital expenditures.
- DCF and WACC Models: Advanced sheets designed for determining intrinsic value and Weighted Average Cost of Capital.
- Editable Inputs: Yellow-highlighted cells available for modifying revenue growth, tax rates, and discount rates.
- Financial Statements: Detailed annual and quarterly financial reports for comprehensive analysis.
- Key Ratios: Metrics on profitability, leverage, and efficiency for performance assessment.
- Dashboard and Charts: Visual representations of valuation results and underlying assumptions.
Disclaimer
All information, articles, and product details provided on this website are for general informational and educational purposes only. We do not claim any ownership over, nor do we intend to infringe upon, any trademarks, copyrights, logos, brand names, or other intellectual property mentioned or depicted on this site. Such intellectual property remains the property of its respective owners, and any references here are made solely for identification or informational purposes, without implying any affiliation, endorsement, or partnership.
We make no representations or warranties, express or implied, regarding the accuracy, completeness, or suitability of any content or products presented. Nothing on this website should be construed as legal, tax, investment, financial, medical, or other professional advice. In addition, no part of this site—including articles or product references—constitutes a solicitation, recommendation, endorsement, advertisement, or offer to buy or sell any securities, franchises, or other financial instruments, particularly in jurisdictions where such activity would be unlawful.
All content is of a general nature and may not address the specific circumstances of any individual or entity. It is not a substitute for professional advice or services. Any actions you take based on the information provided here are strictly at your own risk. You accept full responsibility for any decisions or outcomes arising from your use of this website and agree to release us from any liability in connection with your use of, or reliance upon, the content or products found herein.