
|
SPIC Industry-Finance Holdings Co., Ltd. (000958.SZ) Évaluation DCF |
Entièrement Modifiable: Adapté À Vos Besoins Dans Excel Ou Sheets
Conception Professionnelle: Modèles Fiables Et Conformes Aux Normes Du Secteur
Pré-Construits Pour Une Utilisation Rapide Et Efficace
Compatible MAC/PC, entièrement débloqué
Aucune Expertise N'Est Requise; Facile À Suivre
SPIC Industry-Finance Holdings Co., Ltd. (000958.SZ) Bundle
Explorez les perspectives financières de SPIC Industry-Finance Holdings Co., Ltd. (000958SZ) à l'aide de notre calculatrice DCF conviviale! Entrez vos projections pour la croissance, les marges et les dépenses pour déterminer la valeur intrinsèque de SPIC Industry-Finance Holdings Co., Ltd. (000958SZ) et améliorez votre stratégie d'investissement.
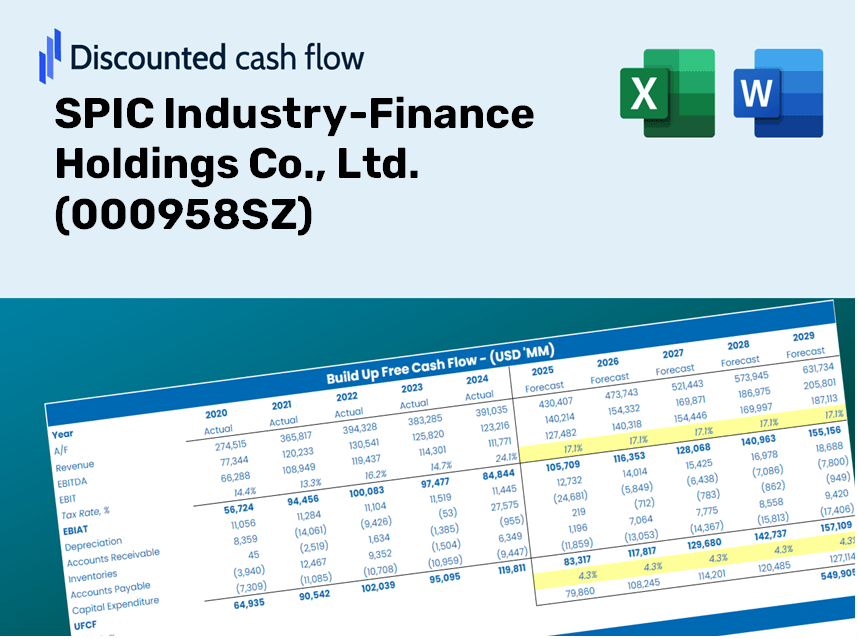
Discounted Cash Flow (DCF) - (USD MM)
| Year | AY1 2020 |
AY2 2021 |
AY3 2022 |
AY4 2023 |
AY5 2024 |
FY1 2025 |
FY2 2026 |
FY3 2027 |
FY4 2028 |
FY5 2029 |
|---|---|---|---|---|---|---|---|---|---|---|
| Revenue | 13,362.7 | 8,871.0 | 6,113.4 | 6,076.8 | 5,744.5 | 4,728.2 | 3,891.7 | 3,203.2 | 2,636.5 | 2,170.1 |
| Revenue Growth, % | 0 | -33.61 | -31.09 | -0.59839 | -5.47 | -17.69 | -17.69 | -17.69 | -17.69 | -17.69 |
| EBITDA | 3,792.7 | 3,076.4 | 2,537.0 | 2,460.8 | 2,723.4 | 1,820.0 | 1,498.0 | 1,233.0 | 1,014.9 | 835.3 |
| EBITDA, % | 28.38 | 34.68 | 41.5 | 40.49 | 47.41 | 38.49 | 38.49 | 38.49 | 38.49 | 38.49 |
| Depreciation | 559.8 | 729.3 | 872.4 | 880.2 | 863.0 | 531.3 | 437.3 | 360.0 | 296.3 | 243.9 |
| Depreciation, % | 4.19 | 8.22 | 14.27 | 14.48 | 15.02 | 11.24 | 11.24 | 11.24 | 11.24 | 11.24 |
| EBIT | 3,232.8 | 2,347.1 | 1,664.7 | 1,580.6 | 1,860.3 | 1,288.7 | 1,060.7 | 873.0 | 718.6 | 591.5 |
| EBIT, % | 24.19 | 26.46 | 27.23 | 26.01 | 32.38 | 27.26 | 27.26 | 27.26 | 27.26 | 27.26 |
| Total Cash | 26,786.9 | 17,233.4 | 19,673.7 | 18,873.2 | 20,655.1 | 4,728.2 | 3,891.7 | 3,203.2 | 2,636.5 | 2,170.1 |
| Total Cash, percent | .0 | .0 | .0 | .0 | .0 | .0 | .0 | .0 | .0 | .0 |
| Account Receivables | 2,400.5 | 2,742.0 | 2,892.7 | 3,676.5 | 4,254.5 | 2,182.1 | 1,796.1 | 1,478.3 | 1,216.8 | 1,001.5 |
| Account Receivables, % | 17.96 | 30.91 | 47.32 | 60.5 | 74.06 | 46.15 | 46.15 | 46.15 | 46.15 | 46.15 |
| Inventories | 198.9 | 305.4 | 128.6 | 144.0 | 128.0 | 110.0 | 90.5 | 74.5 | 61.3 | 50.5 |
| Inventories, % | 1.49 | 3.44 | 2.1 | 2.37 | 2.23 | 2.33 | 2.33 | 2.33 | 2.33 | 2.33 |
| Accounts Payable | 2,021.4 | 1,747.5 | 1,601.8 | 1,517.9 | 1,255.2 | 1,019.9 | 839.5 | 691.0 | 568.7 | 468.1 |
| Accounts Payable, % | 15.13 | 19.7 | 26.2 | 24.98 | 21.85 | 21.57 | 21.57 | 21.57 | 21.57 | 21.57 |
| Capital Expenditure | -2,391.3 | -1,578.1 | -572.8 | -580.7 | -523.3 | -602.6 | -496.0 | -408.2 | -336.0 | -276.6 |
| Capital Expenditure, % | -17.9 | -17.79 | -9.37 | -9.56 | -9.11 | -12.74 | -12.74 | -12.74 | -12.74 | -12.74 |
| Tax Rate, % | 38.82 | 38.82 | 38.82 | 38.82 | 38.82 | 38.82 | 38.82 | 38.82 | 38.82 | 38.82 |
| EBITAT | 1,150.9 | 1,108.5 | 862.8 | 1,046.6 | 1,138.2 | 675.4 | 555.9 | 457.6 | 376.6 | 310.0 |
| Depreciation | ||||||||||
| Changes in Account Receivables | ||||||||||
| Changes in Inventories | ||||||||||
| Changes in Accounts Payable | ||||||||||
| Capital Expenditure | ||||||||||
| UFCF | -1,258.6 | -462.1 | 1,042.8 | 462.8 | 653.4 | 2,459.3 | 722.4 | 594.6 | 489.4 | 402.8 |
| WACC, % | 4.08 | 4.18 | 4.22 | 4.35 | 4.3 | 4.23 | 4.23 | 4.23 | 4.23 | 4.23 |
| PV UFCF | ||||||||||
| SUM PV UFCF | 4,291.9 | |||||||||
| Long Term Growth Rate, % | 2.00 | |||||||||
| Free cash flow (T + 1) | 411 | |||||||||
| Terminal Value | 18,458 | |||||||||
| Present Terminal Value | 15,007 | |||||||||
| Enterprise Value | 19,299 | |||||||||
| Net Debt | 4,303 | |||||||||
| Equity Value | 14,996 | |||||||||
| Diluted Shares Outstanding, MM | 5,384 | |||||||||
| Equity Value Per Share | 2.79 |
What You Will Receive
- Authentic SPIC Data: Comprehensive financials – from revenue to EBIT – derived from actual and projected results.
- Complete Customization: Modify all essential parameters (yellow cells) such as WACC, growth %, and tax rates.
- Immediate Valuation Updates: Automatic recalculations to assess the effect of changes on SPIC’s fair value.
- Flexible Excel Template: Designed for quick adjustments, scenario analysis, and thorough projections.
- Efficient and Accurate: Avoid the hassle of creating models from scratch while ensuring precision and adaptability.
Key Features
- Comprehensive SPIC Data: Pre-loaded with SPIC Industry-Finance Holdings’ historical financial metrics and future projections.
- Fully Customizable Inputs: Tailor revenue growth, profit margins, WACC, tax rates, and capital expenditures to fit your analysis.
- Dynamic Valuation Model: Automatic recalculations of Net Present Value (NPV) and intrinsic value based on your adjusted parameters.
- Scenario Analysis: Develop various forecast scenarios to explore different valuation possibilities.
- User-Centric Design: Intuitive, organized interface suitable for both seasoned professionals and newcomers.
How It Functions
- Download: Get the pre-configured Excel file containing SPIC Industry-Finance Holdings Co., Ltd.'s (000958SZ) financial data.
- Customize: Modify forecasts such as revenue growth, EBITDA %, and WACC to suit your analysis.
- Update Automatically: Watch as the intrinsic value and NPV calculations refresh in real-time.
- Test Scenarios: Generate various projections and instantly evaluate the different outcomes.
- Make Decisions: Leverage the valuation findings to steer your investment approach.
Why Opt for This Calculator?
- User-Friendly: Perfectly crafted for both novices and seasoned professionals.
- Customizable Inputs: Effortlessly adjust parameters to suit your financial analysis.
- Real-Time Adjustments: Witness immediate updates to SPIC Industry-Finance Holdings Co., Ltd. (000958SZ) valuation as you modify inputs.
- Preloaded Data: Comes with SPIC Industry-Finance’s actual financial figures for swift evaluations.
- Relied Upon by Experts: Favored by investors and analysts for making well-informed choices.
Who Can Benefit from This Product?
- Finance Students: Master valuation techniques and apply them to real data through SPIC Industry-Finance Holdings Co., Ltd. (000958SZ).
- Academics: Integrate professional financial models into your curriculum or research focused on SPIC Industry-Finance Holdings Co., Ltd. (000958SZ).
- Investors: Validate your investment hypotheses and evaluate valuation scenarios for SPIC Industry-Finance Holdings Co., Ltd. (000958SZ).
- Analysts: Enhance your efficiency with a customizable DCF model tailored for SPIC Industry-Finance Holdings Co., Ltd. (000958SZ).
- Small Business Owners: Understand the analytical methods used for assessing large public firms like SPIC Industry-Finance Holdings Co., Ltd. (000958SZ).
What the Template Includes
- Pre-Filled DCF Model: SPIC Industry-Finance Holdings Co., Ltd.'s (000958SZ) financial data preloaded for immediate application.
- WACC Calculator: Comprehensive calculations for Weighted Average Cost of Capital.
- Financial Ratios: Assess SPIC Industry-Finance Holdings Co., Ltd.'s profitability, leverage, and operational efficiency.
- Editable Inputs: Modify assumptions related to growth, margins, and CAPEX to tailor your scenarios.
- Financial Statements: Annual and quarterly reports to facilitate in-depth analysis.
- Interactive Dashboard: Effortlessly visualize essential valuation metrics and outcomes.
Disclaimer
All information, articles, and product details provided on this website are for general informational and educational purposes only. We do not claim any ownership over, nor do we intend to infringe upon, any trademarks, copyrights, logos, brand names, or other intellectual property mentioned or depicted on this site. Such intellectual property remains the property of its respective owners, and any references here are made solely for identification or informational purposes, without implying any affiliation, endorsement, or partnership.
We make no representations or warranties, express or implied, regarding the accuracy, completeness, or suitability of any content or products presented. Nothing on this website should be construed as legal, tax, investment, financial, medical, or other professional advice. In addition, no part of this site—including articles or product references—constitutes a solicitation, recommendation, endorsement, advertisement, or offer to buy or sell any securities, franchises, or other financial instruments, particularly in jurisdictions where such activity would be unlawful.
All content is of a general nature and may not address the specific circumstances of any individual or entity. It is not a substitute for professional advice or services. Any actions you take based on the information provided here are strictly at your own risk. You accept full responsibility for any decisions or outcomes arising from your use of this website and agree to release us from any liability in connection with your use of, or reliance upon, the content or products found herein.