
|
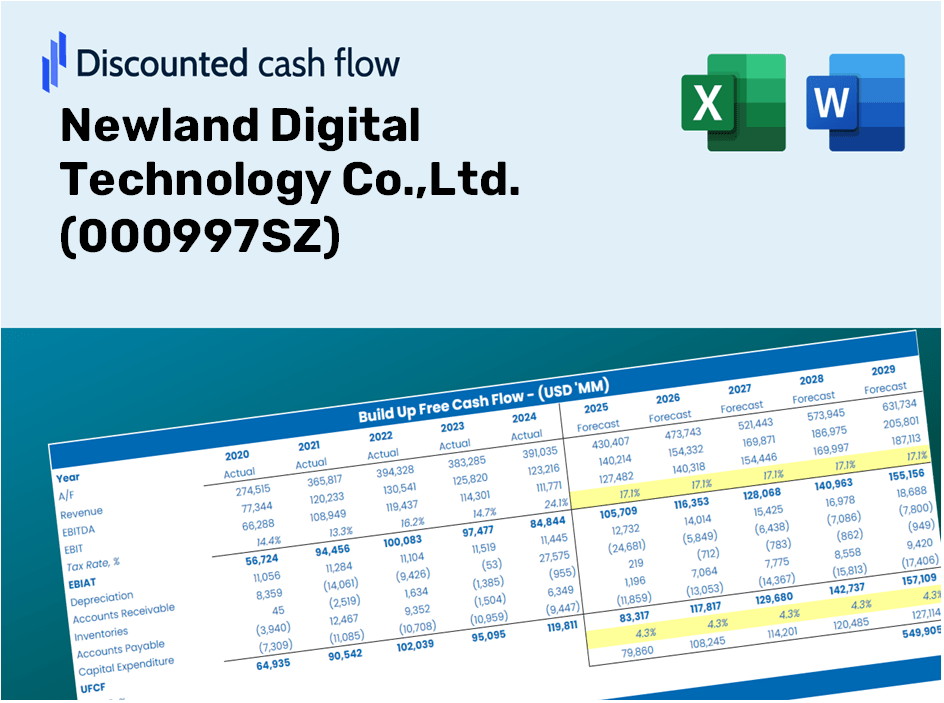
Newland Digital Technology Co., Ltd. (000997.sz) Évaluation DCF |
Entièrement Modifiable: Adapté À Vos Besoins Dans Excel Ou Sheets
Conception Professionnelle: Modèles Fiables Et Conformes Aux Normes Du Secteur
Pré-Construits Pour Une Utilisation Rapide Et Efficace
Compatible MAC/PC, entièrement débloqué
Aucune Expertise N'Est Requise; Facile À Suivre
Newland Digital Technology Co.,Ltd. (000997.SZ) Bundle
Conçu pour la précision, notre (000997SZ) la calculatrice DCF vous permet d'évaluer l'évaluation de Newland Digital Technology Co., Ltd. à l'aide de données financières réelles, tout en offrant une flexibilité complète pour modifier tous les paramètres essentiels pour des projections améliorées.
Discounted Cash Flow (DCF) - (USD MM)
| Year | AY1 2020 |
AY2 2021 |
AY3 2022 |
AY4 2023 |
AY5 2024 |
FY1 2025 |
FY2 2026 |
FY3 2027 |
FY4 2028 |
FY5 2029 |
|---|---|---|---|---|---|---|---|---|---|---|
| Revenue | 7,062.9 | 7,698.2 | 7,369.9 | 8,249.5 | 7,745.3 | 7,949.6 | 8,159.4 | 8,374.7 | 8,595.6 | 8,822.4 |
| Revenue Growth, % | 0 | 8.99 | -4.26 | 11.94 | -6.11 | 2.64 | 2.64 | 2.64 | 2.64 | 2.64 |
| EBITDA | 873.4 | 883.9 | 548.7 | 1,307.7 | 1,167.9 | 989.3 | 1,015.4 | 1,042.2 | 1,069.7 | 1,097.9 |
| EBITDA, % | 12.37 | 11.48 | 7.44 | 15.85 | 15.08 | 12.44 | 12.44 | 12.44 | 12.44 | 12.44 |
| Depreciation | 332.9 | 226.9 | 102.4 | 76.1 | 57.3 | 170.3 | 174.8 | 179.4 | 184.2 | 189.0 |
| Depreciation, % | 4.71 | 2.95 | 1.39 | 0.922 | 0.73927 | 2.14 | 2.14 | 2.14 | 2.14 | 2.14 |
| EBIT | 540.5 | 656.9 | 446.2 | 1,231.6 | 1,110.6 | 819.0 | 840.6 | 862.8 | 885.5 | 908.9 |
| EBIT, % | 7.65 | 8.53 | 6.05 | 14.93 | 14.34 | 10.3 | 10.3 | 10.3 | 10.3 | 10.3 |
| Total Cash | 4,600.6 | 4,098.8 | 3,831.0 | 4,777.8 | 4,316.1 | 4,515.5 | 4,634.6 | 4,756.9 | 4,882.4 | 5,011.2 |
| Total Cash, percent | .0 | .0 | .0 | .0 | .0 | .0 | .0 | .0 | .0 | .0 |
| Account Receivables | 2,089.6 | 1,955.8 | 2,257.3 | 1,073.6 | 2,091.4 | 1,997.5 | 2,050.2 | 2,104.3 | 2,159.8 | 2,216.8 |
| Account Receivables, % | 29.59 | 25.41 | 30.63 | 13.01 | 27 | 25.13 | 25.13 | 25.13 | 25.13 | 25.13 |
| Inventories | 902.9 | 1,136.2 | 1,060.9 | 882.6 | 958.0 | 1,033.5 | 1,060.8 | 1,088.8 | 1,117.5 | 1,147.0 |
| Inventories, % | 12.78 | 14.76 | 14.39 | 10.7 | 12.37 | 13 | 13 | 13 | 13 | 13 |
| Accounts Payable | 914.9 | 1,088.1 | 758.7 | 797.7 | 1,208.9 | 996.3 | 1,022.6 | 1,049.5 | 1,077.2 | 1,105.7 |
| Accounts Payable, % | 12.95 | 14.14 | 10.29 | 9.67 | 15.61 | 12.53 | 12.53 | 12.53 | 12.53 | 12.53 |
| Capital Expenditure | -133.8 | -76.0 | -167.5 | -58.6 | -95.1 | -112.8 | -115.7 | -118.8 | -121.9 | -125.1 |
| Capital Expenditure, % | -1.89 | -0.98675 | -2.27 | -0.71072 | -1.23 | -1.42 | -1.42 | -1.42 | -1.42 | -1.42 |
| Tax Rate, % | 17 | 17 | 17 | 17 | 17 | 17 | 17 | 17 | 17 | 17 |
| EBITAT | 435.9 | 539.7 | 493.2 | 1,083.9 | 921.9 | 710.6 | 729.3 | 748.5 | 768.3 | 788.6 |
| Depreciation | ||||||||||
| Changes in Account Receivables | ||||||||||
| Changes in Inventories | ||||||||||
| Changes in Accounts Payable | ||||||||||
| Capital Expenditure | ||||||||||
| UFCF | -1,442.5 | 764.3 | -127.5 | 2,502.3 | 202.1 | 573.8 | 734.7 | 754.1 | 774.0 | 794.4 |
| WACC, % | 5.22 | 5.22 | 5.24 | 5.23 | 5.22 | 5.23 | 5.23 | 5.23 | 5.23 | 5.23 |
| PV UFCF | ||||||||||
| SUM PV UFCF | 3,103.0 | |||||||||
| Long Term Growth Rate, % | 4.00 | |||||||||
| Free cash flow (T + 1) | 826 | |||||||||
| Terminal Value | 67,264 | |||||||||
| Present Terminal Value | 52,134 | |||||||||
| Enterprise Value | 55,237 | |||||||||
| Net Debt | -3,438 | |||||||||
| Equity Value | 58,675 | |||||||||
| Diluted Shares Outstanding, MM | 1,013 | |||||||||
| Equity Value Per Share | 57.92 |
What You Will Receive
- Authentic Newland Digital Financials: Access to historical and projected data for precise valuation.
- Customizable Inputs: Adjust parameters like WACC, tax rates, revenue growth, and capital expenditures.
- Dynamic Calculations: Intrinsic value and NPV are computed in real-time.
- Scenario Analysis: Evaluate various scenarios to assess the future performance of Newland Digital Technology (000997SZ).
- User-Friendly Design: Designed for professionals but easy for newcomers to navigate.
Key Features
- Accurate Financial Data for Newland Digital Technology: Gain access to precise historical figures and future forecasts pre-loaded for [000997SZ].
- Personalized Forecast Inputs: Modify highlighted cells to adjust parameters such as WACC, growth rates, and profit margins.
- Real-Time Calculations: Enjoy automatic updates for DCF, Net Present Value (NPV), and cash flow assessments.
- User-Friendly Dashboard: Easily digestible charts and summaries to help you interpret your valuation outcomes.
- Designed for All Levels: An intuitive layout tailored for investors, CFOs, and consultants, whether experts or novices.
How It Works
- Step 1: Download the prebuilt Excel template featuring Newland Digital Technology Co., Ltd.'s data.
- Step 2: Review the pre-filled sheets to familiarize yourself with the key metrics.
- Step 3: Adjust forecasts and assumptions in the editable yellow cells (WACC, growth, margins).
- Step 4: Immediately see the updated results, including Newland Digital Technology Co., Ltd.'s intrinsic value.
- Step 5: Use the outputs to make informed investment decisions or create reports.
Why Choose Our Calculator for Newland Digital Technology Co., Ltd. (000997SZ)?
- Designed for Experts: A sophisticated tool tailored for financial analysts, CFOs, and consultants.
- Accurate Data: Historical and projected financials of Newland Digital are integrated for precision.
- Flexible Scenario Analysis: Easily model various forecasts and assumptions.
- Intuitive Outputs: Automatically generates intrinsic value, NPV, and essential financial metrics.
- User-Friendly: Clear, step-by-step guidance simplifies your experience.
Who Should Use This Product?
- Individual Investors: Make informed choices about trading Newland Digital Technology Co., Ltd. (000997SZ) shares.
- Financial Analysts: Enhance valuation processes with ready-to-apply financial models tailored for Newland Digital Technology Co., Ltd. (000997SZ).
- Consultants: Provide clients with accurate and timely valuation insights regarding Newland Digital Technology Co., Ltd. (000997SZ).
- Business Owners: Gain insights into the valuation of tech companies like Newland Digital Technology Co., Ltd. (000997SZ) to inform your own business strategies.
- Finance Students: Explore valuation methodologies utilizing real data and case studies from Newland Digital Technology Co., Ltd. (000997SZ).
Contents of the Template
- Pre-Filled Data: Contains historical financials and projections for Newland Digital Technology Co., Ltd. (000997SZ).
- Discounted Cash Flow Model: An editable DCF valuation model featuring automatic calculations.
- Weighted Average Cost of Capital (WACC): A dedicated worksheet for calculating WACC using custom inputs.
- Key Financial Ratios: Assess Newland's profitability, efficiency, and financial leverage.
- Customizable Inputs: Easily adjust revenue growth, profit margins, and tax rates.
- Clear Dashboard: Visual representations and tables summarizing essential valuation outcomes.
Disclaimer
All information, articles, and product details provided on this website are for general informational and educational purposes only. We do not claim any ownership over, nor do we intend to infringe upon, any trademarks, copyrights, logos, brand names, or other intellectual property mentioned or depicted on this site. Such intellectual property remains the property of its respective owners, and any references here are made solely for identification or informational purposes, without implying any affiliation, endorsement, or partnership.
We make no representations or warranties, express or implied, regarding the accuracy, completeness, or suitability of any content or products presented. Nothing on this website should be construed as legal, tax, investment, financial, medical, or other professional advice. In addition, no part of this site—including articles or product references—constitutes a solicitation, recommendation, endorsement, advertisement, or offer to buy or sell any securities, franchises, or other financial instruments, particularly in jurisdictions where such activity would be unlawful.
All content is of a general nature and may not address the specific circumstances of any individual or entity. It is not a substitute for professional advice or services. Any actions you take based on the information provided here are strictly at your own risk. You accept full responsibility for any decisions or outcomes arising from your use of this website and agree to release us from any liability in connection with your use of, or reliance upon, the content or products found herein.