
|
EMDOOR INFORMATION CO., LTD. (001314.SZ) Évaluation DCF |
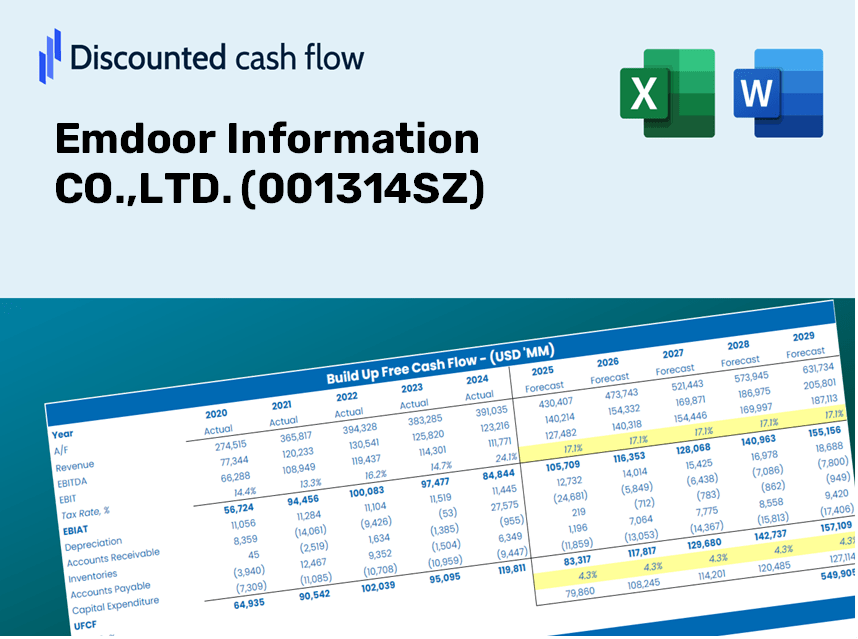
Entièrement Modifiable: Adapté À Vos Besoins Dans Excel Ou Sheets
Conception Professionnelle: Modèles Fiables Et Conformes Aux Normes Du Secteur
Pré-Construits Pour Une Utilisation Rapide Et Efficace
Compatible MAC/PC, entièrement débloqué
Aucune Expertise N'Est Requise; Facile À Suivre
Emdoor Information CO.,LTD. (001314.SZ) Bundle
Optimisez votre temps et améliorez la précision avec notre calculatrice DCF (001314SZ)! Utilisation de données réelles d'Emdoor Information CO., Ltd. Et des hypothèses personnalisables, cet outil vous permet de prévoir, analyser et valoriser Emdoor comme un investisseur chevronné.
Discounted Cash Flow (DCF) - (USD MM)
| Year | AY1 2020 |
AY2 2021 |
AY3 2022 |
AY4 2023 |
AY5 2024 |
FY1 2025 |
FY2 2026 |
FY3 2027 |
FY4 2028 |
FY5 2029 |
|---|---|---|---|---|---|---|---|---|---|---|
| Revenue | 1,911.2 | 3,391.5 | 2,753.9 | 2,593.5 | 3,179.6 | 3,779.2 | 4,491.8 | 5,338.8 | 6,345.5 | 7,542.1 |
| Revenue Growth, % | 0 | 77.45 | -18.8 | -5.82 | 22.6 | 18.86 | 18.86 | 18.86 | 18.86 | 18.86 |
| EBITDA | 193.4 | 246.7 | 163.9 | 89.7 | 29.4 | 209.6 | 249.1 | 296.1 | 351.9 | 418.3 |
| EBITDA, % | 10.12 | 7.27 | 5.95 | 3.46 | 0.92357 | 5.55 | 5.55 | 5.55 | 5.55 | 5.55 |
| Depreciation | 4.0 | 10.4 | 13.4 | 17.2 | 44.9 | 23.3 | 27.7 | 32.9 | 39.1 | 46.5 |
| Depreciation, % | 0.21072 | 0.30727 | 0.48622 | 0.6643 | 1.41 | 0.6164 | 0.6164 | 0.6164 | 0.6164 | 0.6164 |
| EBIT | 189.4 | 236.3 | 150.5 | 72.5 | -15.6 | 186.3 | 221.4 | 263.2 | 312.8 | 371.8 |
| EBIT, % | 9.91 | 6.97 | 5.46 | 2.8 | -0.48995 | 4.93 | 4.93 | 4.93 | 4.93 | 4.93 |
| Total Cash | 377.3 | 565.0 | 497.4 | 1,358.3 | 1,296.9 | 1,115.8 | 1,326.1 | 1,576.2 | 1,873.4 | 2,226.7 |
| Total Cash, percent | .0 | .0 | .0 | .0 | .0 | .0 | .0 | .0 | .0 | .0 |
| Account Receivables | 164.4 | 229.2 | 229.9 | 292.7 | 436.1 | 368.1 | 437.6 | 520.1 | 618.2 | 734.7 |
| Account Receivables, % | 8.6 | 6.76 | 8.35 | 11.29 | 13.71 | 9.74 | 9.74 | 9.74 | 9.74 | 9.74 |
| Inventories | 389.1 | 482.6 | 546.1 | 526.0 | 628.1 | 713.9 | 848.5 | 1,008.5 | 1,198.7 | 1,424.7 |
| Inventories, % | 20.36 | 14.23 | 19.83 | 20.28 | 19.75 | 18.89 | 18.89 | 18.89 | 18.89 | 18.89 |
| Accounts Payable | 343.5 | 556.2 | 323.9 | 492.7 | 604.0 | 635.9 | 755.8 | 898.3 | 1,067.6 | 1,269.0 |
| Accounts Payable, % | 17.97 | 16.4 | 11.76 | 19 | 19 | 16.83 | 16.83 | 16.83 | 16.83 | 16.83 |
| Capital Expenditure | -66.2 | -77.9 | -200.5 | -149.2 | -135.0 | -174.2 | -207.0 | -246.1 | -292.5 | -347.6 |
| Capital Expenditure, % | -3.47 | -2.3 | -7.28 | -5.75 | -4.25 | -4.61 | -4.61 | -4.61 | -4.61 | -4.61 |
| Tax Rate, % | -199.52 | -199.52 | -199.52 | -199.52 | -199.52 | -199.52 | -199.52 | -199.52 | -199.52 | -199.52 |
| EBITAT | 170.0 | 218.7 | 142.5 | 78.5 | -46.7 | 177.7 | 211.2 | 251.1 | 298.4 | 354.7 |
| Depreciation | ||||||||||
| Changes in Account Receivables | ||||||||||
| Changes in Inventories | ||||||||||
| Changes in Accounts Payable | ||||||||||
| Capital Expenditure | ||||||||||
| UFCF | -102.2 | 205.6 | -341.0 | 72.4 | -270.9 | 40.8 | -52.2 | -62.1 | -73.8 | -87.7 |
| WACC, % | 7.83 | 7.83 | 7.83 | 7.84 | 7.84 | 7.83 | 7.83 | 7.83 | 7.83 | 7.83 |
| PV UFCF | ||||||||||
| SUM PV UFCF | -171.3 | |||||||||
| Long Term Growth Rate, % | 2.00 | |||||||||
| Free cash flow (T + 1) | -89 | |||||||||
| Terminal Value | -1,534 | |||||||||
| Present Terminal Value | -1,052 | |||||||||
| Enterprise Value | -1,223 | |||||||||
| Net Debt | -1,135 | |||||||||
| Equity Value | -88 | |||||||||
| Diluted Shares Outstanding, MM | 142 | |||||||||
| Equity Value Per Share | -0.62 |
Benefits You Will Receive
- Genuine Emdoor Financial Data: Pre-populated with historical and forecasted figures for precise analysis of Emdoor Information Co., Ltd. (001314SZ).
- Comprehensive Editable Template: Easily adjust key variables such as revenue growth, WACC, and EBITDA percentage.
- Instant Calculations: Watch as the intrinsic value of Emdoor updates automatically in response to your modifications.
- Expert Valuation Tool: Tailored for investors, analysts, and consultants aiming for reliable DCF outcomes.
- Intuitive Design: User-friendly layout and straightforward instructions suitable for all skill levels.
Key Features
- 🔍 Real-Life Emdoor Financials: Pre-filled historical and projected data for Emdoor Information CO.,LTD. (001314SZ).
- ✏️ Fully Customizable Inputs: Tailor all essential parameters (yellow cells) such as WACC, growth %, and tax rates.
- 📊 Professional DCF Valuation: Integrated formulas compute Emdoor’s intrinsic value utilizing the Discounted Cash Flow approach.
- ⚡ Instant Results: View Emdoor’s valuation immediately after making adjustments.
- Scenario Analysis: Evaluate and compare various financial assumptions side-by-side.
How It Works
- Download: Obtain the pre-prepared Excel file containing Emdoor Information CO.,LTD.'s (001314SZ) financial data.
- Customize: Modify projections such as revenue growth, EBITDA %, and WACC to suit your analysis.
- Update Automatically: Enjoy real-time updates for the intrinsic value and NPV calculations.
- Test Scenarios: Generate various forecasts and instantly compare the results.
- Make Decisions: Leverage the valuation insights to inform your investment choices.
Why Choose This Calculator for Emdoor Information CO.,LTD. (001314SZ)?
- Designed for Experts: A sophisticated tool preferred by financial analysts, CFOs, and consultants.
- Comprehensive Data: Access to Emdoor's historical and forecasted financials for enhanced accuracy.
- Flexible Scenario Analysis: Effortlessly test various forecasts and assumptions.
- Transparent Results: Automatically computes intrinsic value, NPV, and essential metrics.
- User-Friendly: Clear, step-by-step guidance to navigate the calculations smoothly.
Who Should Use This Product?
- Individual Investors: Gain insights to make educated decisions about investing in Emdoor Information CO.,LTD. (001314SZ).
- Financial Analysts: Enhance your valuation assessments with efficient, pre-built financial models.
- Consultants: Provide your clients with rapid and precise valuation analyses for Emdoor Information CO.,LTD. (001314SZ).
- Business Owners: Learn how large firms like Emdoor Information CO.,LTD. (001314SZ) are appraised to inform your own business strategies.
- Finance Students: Master valuation methodologies by utilizing real-life data and case studies related to Emdoor Information CO.,LTD. (001314SZ).
Contents of the Template
- Historical Data: Contains Emdoor Information Co., Ltd.'s (001314SZ) previous financial records and foundational forecasts.
- DCF and Levered DCF Models: Comprehensive templates for assessing the intrinsic value of Emdoor Information Co., Ltd. (001314SZ).
- WACC Sheet: Ready-to-use calculations for the Weighted Average Cost of Capital.
- Editable Inputs: Customize essential variables such as growth rates, EBITDA percentages, and CAPEX assumptions.
- Quarterly and Annual Statements: A thorough analysis of Emdoor Information Co., Ltd.'s (001314SZ) financial performance.
- Interactive Dashboard: Dynamically visualize valuation outcomes and future projections.
Disclaimer
All information, articles, and product details provided on this website are for general informational and educational purposes only. We do not claim any ownership over, nor do we intend to infringe upon, any trademarks, copyrights, logos, brand names, or other intellectual property mentioned or depicted on this site. Such intellectual property remains the property of its respective owners, and any references here are made solely for identification or informational purposes, without implying any affiliation, endorsement, or partnership.
We make no representations or warranties, express or implied, regarding the accuracy, completeness, or suitability of any content or products presented. Nothing on this website should be construed as legal, tax, investment, financial, medical, or other professional advice. In addition, no part of this site—including articles or product references—constitutes a solicitation, recommendation, endorsement, advertisement, or offer to buy or sell any securities, franchises, or other financial instruments, particularly in jurisdictions where such activity would be unlawful.
All content is of a general nature and may not address the specific circumstances of any individual or entity. It is not a substitute for professional advice or services. Any actions you take based on the information provided here are strictly at your own risk. You accept full responsibility for any decisions or outcomes arising from your use of this website and agree to release us from any liability in connection with your use of, or reliance upon, the content or products found herein.