
|
JWIPC Technology Co., Ltd. (001339.SZ) Évaluation DCF |
Entièrement Modifiable: Adapté À Vos Besoins Dans Excel Ou Sheets
Conception Professionnelle: Modèles Fiables Et Conformes Aux Normes Du Secteur
Pré-Construits Pour Une Utilisation Rapide Et Efficace
Compatible MAC/PC, entièrement débloqué
Aucune Expertise N'Est Requise; Facile À Suivre
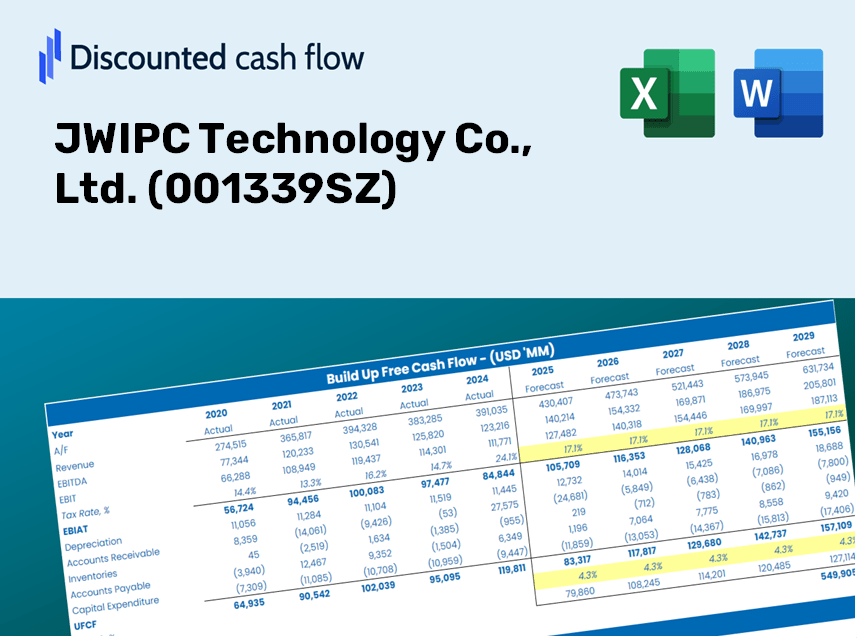
JWIPC Technology Co., Ltd. (001339.SZ) Bundle
Conçu pour la précision, notre calculatrice DCF (001339SZ) vous permet d'évaluer la valorisation de JWIPC Technology Co., Ltd. à l'aide de données financières réelles et offre une flexibilité complète pour modifier tous les paramètres essentiels pour des projestes améliorées.
Discounted Cash Flow (DCF) - (USD MM)
| Year | AY1 2020 |
AY2 2021 |
AY3 2022 |
AY4 2023 |
AY5 2024 |
FY1 2025 |
FY2 2026 |
FY3 2027 |
FY4 2028 |
FY5 2029 |
|---|---|---|---|---|---|---|---|---|---|---|
| Revenue | 1,932.5 | 2,700.0 | 3,032.7 | 3,665.4 | 4,034.1 | 4,870.8 | 5,881.0 | 7,100.7 | 8,573.3 | 10,351.4 |
| Revenue Growth, % | 0 | 39.71 | 12.32 | 20.86 | 10.06 | 20.74 | 20.74 | 20.74 | 20.74 | 20.74 |
| EBITDA | 151.7 | 209.0 | 145.2 | 64.5 | 303.9 | 289.0 | 349.0 | 421.4 | 508.7 | 614.3 |
| EBITDA, % | 7.85 | 7.74 | 4.79 | 1.76 | 7.53 | 5.93 | 5.93 | 5.93 | 5.93 | 5.93 |
| Depreciation | 7.9 | 13.2 | 20.3 | 45.3 | 53.3 | 40.2 | 48.5 | 58.6 | 70.8 | 85.4 |
| Depreciation, % | 0.41062 | 0.49072 | 0.66908 | 1.24 | 1.32 | 0.8253 | 0.8253 | 0.8253 | 0.8253 | 0.8253 |
| EBIT | 143.7 | 195.8 | 124.9 | 19.2 | 250.6 | 248.8 | 300.4 | 362.8 | 438.0 | 528.8 |
| EBIT, % | 7.44 | 7.25 | 4.12 | 0.52401 | 6.21 | 5.11 | 5.11 | 5.11 | 5.11 | 5.11 |
| Total Cash | 203.0 | 158.0 | 921.9 | 766.3 | 2,476.8 | 1,257.3 | 1,518.0 | 1,832.9 | 2,213.0 | 2,671.9 |
| Total Cash, percent | .0 | .0 | .0 | .0 | .0 | .0 | .0 | .0 | .0 | .0 |
| Account Receivables | 407.7 | 481.7 | 553.1 | 862.8 | 886.8 | 1,000.4 | 1,207.9 | 1,458.4 | 1,760.9 | 2,126.1 |
| Account Receivables, % | 21.1 | 17.84 | 18.24 | 23.54 | 21.98 | 20.54 | 20.54 | 20.54 | 20.54 | 20.54 |
| Inventories | 404.6 | 801.9 | 846.1 | 732.7 | 855.8 | 1,166.4 | 1,408.4 | 1,700.5 | 2,053.1 | 2,478.9 |
| Inventories, % | 20.93 | 29.7 | 27.9 | 19.99 | 21.21 | 23.95 | 23.95 | 23.95 | 23.95 | 23.95 |
| Accounts Payable | 496.6 | 725.1 | 791.7 | 1,038.1 | 2,008.5 | 1,527.1 | 1,843.8 | 2,226.2 | 2,688.0 | 3,245.4 |
| Accounts Payable, % | 25.69 | 26.86 | 26.1 | 28.32 | 49.79 | 31.35 | 31.35 | 31.35 | 31.35 | 31.35 |
| Capital Expenditure | -80.4 | -104.0 | -328.6 | -268.4 | -86.9 | -275.9 | -333.1 | -402.2 | -485.6 | -586.3 |
| Capital Expenditure, % | -4.16 | -3.85 | -10.84 | -7.32 | -2.15 | -5.66 | -5.66 | -5.66 | -5.66 | -5.66 |
| Tax Rate, % | 48.55 | 48.55 | 48.55 | 48.55 | 48.55 | 48.55 | 48.55 | 48.55 | 48.55 | 48.55 |
| EBITAT | 129.1 | 179.3 | 130.7 | 20.7 | 128.9 | 215.4 | 260.1 | 314.0 | 379.2 | 457.8 |
| Depreciation | ||||||||||
| Changes in Account Receivables | ||||||||||
| Changes in Inventories | ||||||||||
| Changes in Accounts Payable | ||||||||||
| Capital Expenditure | ||||||||||
| UFCF | -259.0 | -154.3 | -226.7 | -152.2 | 918.7 | -926.0 | -157.2 | -189.8 | -229.1 | -276.6 |
| WACC, % | 5.82 | 5.82 | 5.84 | 5.84 | 5.74 | 5.81 | 5.81 | 5.81 | 5.81 | 5.81 |
| PV UFCF | ||||||||||
| SUM PV UFCF | -1,567.0 | |||||||||
| Long Term Growth Rate, % | 3.50 | |||||||||
| Free cash flow (T + 1) | -286 | |||||||||
| Terminal Value | -12,391 | |||||||||
| Present Terminal Value | -9,342 | |||||||||
| Enterprise Value | -10,909 | |||||||||
| Net Debt | -708 | |||||||||
| Equity Value | -10,202 | |||||||||
| Diluted Shares Outstanding, MM | 250 | |||||||||
| Equity Value Per Share | -40.83 |
What You Will Receive
- Flexible Input Parameters: Effortlessly modify key assumptions (growth %, profit margins, discount rates) to generate various scenarios.
- Proven Industry Data: JWIPC Technology Co., Ltd.’s financial information pre-loaded to kickstart your evaluation.
- Automated Valuation Outputs: The template computes Net Present Value (NPV) and intrinsic value for you automatically.
- Tailored and Professional Design: A sophisticated Excel model that aligns with your valuation requirements.
- Designed for Analysts and Investors: Perfect for assessing projections, confirming strategies, and optimizing efficiency.
Key Features
- Authentic Financial Data: Gain access to reliable historical performance and future forecasts specific to JWIPC Technology Co., Ltd. (001339SZ).
- Tailored Forecast Inputs: Modify highlighted cells to adjust parameters like WACC, growth rates, and profit margins.
- Real-Time Calculations: Immediate updates to DCF, Net Present Value (NPV), and cash flow assessments.
- Interactive Dashboard: Intuitive charts and summaries designed for clear visualization of your valuation outcomes.
- Suitable for All Levels: A user-friendly layout designed with the needs of investors, CFOs, and consultants in mind.
How It Works
- Step 1: Download the Excel file for JWIPC Technology Co., Ltd. (001339SZ).
- Step 2: Review the pre-filled financial data and forecasts for JWIPC Technology.
- Step 3: Modify key inputs such as revenue growth, WACC, and tax rates (highlighted cells).
- Step 4: See the DCF model update in real-time as you adjust your assumptions.
- Step 5: Analyze the outputs to inform your investment decisions regarding JWIPC Technology.
Why Choose JWIPC Technology Co., Ltd. (001339SZ) Calculator?
- All-in-One Solution: Offers DCF, WACC, and a range of financial ratio analyses seamlessly integrated.
- Flexible Variables: Modify the highlighted cells to explore different financial scenarios.
- In-Depth Analysis: Automatically determines the intrinsic value and Net Present Value for JWIPC Technology.
- Data-Rich Environment: Comes with both historical and projected data for precise calculations.
- High-Quality Standards: Tailored for financial analysts, investors, and business consultants.
Who Can Benefit from JWIPC Technology Co., Ltd. (001339SZ)?
- Investors: Gain insights and make informed decisions with our industry-leading analytics tools.
- Financial Analysts: Streamline your analysis process using our customizable financial models.
- Consultants: Efficiently modify our templates for impactful client presentations and comprehensive reports.
- Tech Enthusiasts: Enhance your knowledge of technology valuation with practical, real-world examples.
- Educators and Students: Utilize our resources as a hands-on learning tool in technology and finance courses.
What the Template Includes
- Pre-Filled Data: Contains JWIPC Technology Co., Ltd.'s historical financials and projections.
- Discounted Cash Flow Model: An editable DCF valuation model featuring automatic calculations.
- Weighted Average Cost of Capital (WACC): A dedicated sheet for determining WACC using custom inputs.
- Key Financial Ratios: Assess JWIPC's profitability, efficiency, and leverage.
- Customizable Inputs: Easily modify revenue growth, margins, and tax rates.
- Informative Dashboard: Visualizations and tables highlighting key valuation outcomes.
Disclaimer
All information, articles, and product details provided on this website are for general informational and educational purposes only. We do not claim any ownership over, nor do we intend to infringe upon, any trademarks, copyrights, logos, brand names, or other intellectual property mentioned or depicted on this site. Such intellectual property remains the property of its respective owners, and any references here are made solely for identification or informational purposes, without implying any affiliation, endorsement, or partnership.
We make no representations or warranties, express or implied, regarding the accuracy, completeness, or suitability of any content or products presented. Nothing on this website should be construed as legal, tax, investment, financial, medical, or other professional advice. In addition, no part of this site—including articles or product references—constitutes a solicitation, recommendation, endorsement, advertisement, or offer to buy or sell any securities, franchises, or other financial instruments, particularly in jurisdictions where such activity would be unlawful.
All content is of a general nature and may not address the specific circumstances of any individual or entity. It is not a substitute for professional advice or services. Any actions you take based on the information provided here are strictly at your own risk. You accept full responsibility for any decisions or outcomes arising from your use of this website and agree to release us from any liability in connection with your use of, or reliance upon, the content or products found herein.