
|
Suning.com Co., Ltd. (002024.SZ) Évaluation DCF |
Entièrement Modifiable: Adapté À Vos Besoins Dans Excel Ou Sheets
Conception Professionnelle: Modèles Fiables Et Conformes Aux Normes Du Secteur
Pré-Construits Pour Une Utilisation Rapide Et Efficace
Compatible MAC/PC, entièrement débloqué
Aucune Expertise N'Est Requise; Facile À Suivre
Suning.com Co., Ltd. (002024.SZ) Bundle
Rationalisez votre analyse et améliorez la précision avec notre calculatrice DCF (002024SZ)! Équipée des données Authentic Suning.com Co., Ltd. et des hypothèses personnalisables, cet outil vous permet de prévoir, analyser et valoriser Suning.com comme un investisseur chevronné.
What You Will Receive
- Customizable Excel Template: A fully adaptable Excel-based DCF Calculator featuring pre-filled financial data for Suning.com Co., Ltd. (002024SZ).
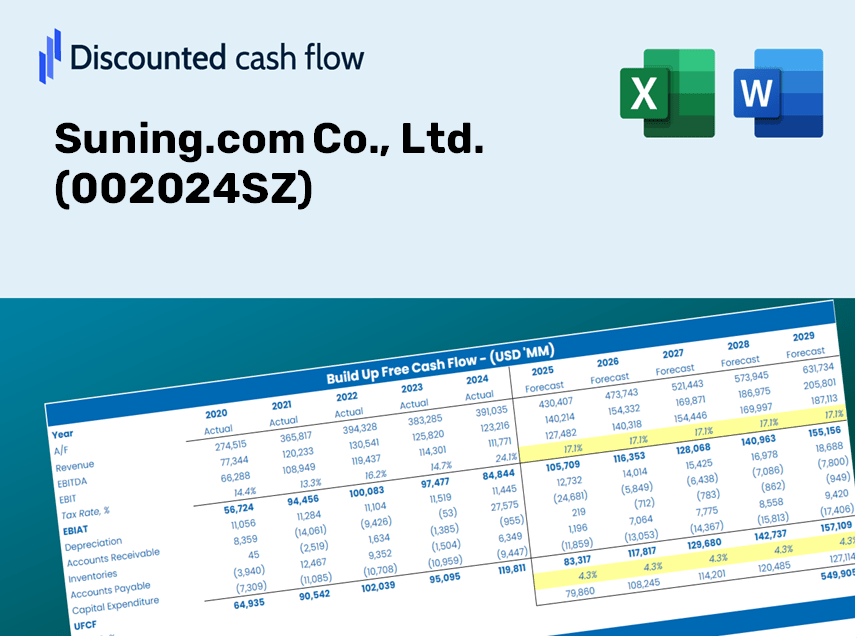
- Accurate Data: Access to historical financials and forward-looking projections (highlighted in the yellow cells).
- Forecasting Flexibility: Adjust assumptions related to revenue growth, EBITDA %, and WACC as needed.
- Instant Calculations: Quickly observe how your inputs affect the valuation of Suning.com Co., Ltd. (002024SZ).
- Professional Resource: Designed for investors, CFOs, consultants, and financial analysts.
- User-Friendly Layout: Organized for ease of understanding and usability, complete with step-by-step guidance.
Key Features
- Accurate Financial Data: Gain access to reliable historical figures and future forecasts for Suning.com Co., Ltd. (002024SZ).
- Tailored Forecast Parameters: Modify highlighted fields such as WACC, growth rates, and profit margins.
- Real-Time Calculations: Automatic updates for DCF, Net Present Value (NPV), and cash flow analyses.
- Interactive Dashboard: User-friendly charts and summaries for a clear visualization of your valuation outcomes.
- Designed for All Skill Levels: An intuitive layout catering to investors, CFOs, and consultants alike.
How It Functions
- 1. Access the Template: Download and open the Excel file featuring Suning.com's preloaded data.
- 2. Adjust Assumptions: Modify key parameters such as growth rates, WACC, and capital expenditures.
- 3. View Results Instantly: The DCF model automatically calculates intrinsic value and NPV in real-time.
- 4. Explore Scenarios: Evaluate multiple forecasts to understand various valuation possibilities.
- 5. Present with Assurance: Deliver professional valuation insights to aid in your decision-making process.
Why Choose This Calculator for Suning.com (002024SZ)?
- User-Friendly Interface: Perfectly suited for both novices and seasoned professionals.
- Customizable Inputs: Easily adjust parameters to fit your specific analysis needs.
- Real-Time Updates: View immediate changes to Suning.com’s valuation as you modify inputs.
- Preloaded Data: Comes with Suning.com’s actual financial information for swift evaluations.
- Favored by Experts: Utilized by investors and analysts to drive well-informed decisions.
Who Can Benefit from This Product?
- Institutional Investors: Develop comprehensive and dependable valuation models for analyzing their portfolios related to Suning.com Co., Ltd. (002024SZ).
- Corporate Finance Teams: Examine valuation scenarios to inform and enhance internal strategies for Suning.com Co., Ltd. (002024SZ).
- Consultants and Advisors: Equip clients with precise valuation insights regarding Suning.com Co., Ltd. (002024SZ).
- Students and Educators: Utilize real-world data to learn and instruct on financial modeling principles involving Suning.com Co., Ltd. (002024SZ).
- Market Enthusiasts: Gain insights into the valuation of e-commerce giants like Suning.com Co., Ltd. (002024SZ) in the marketplace.
Contents of the Template
- Pre-Filled DCF Model: Suning.com's financial data ready for immediate application.
- WACC Calculator: Comprehensive calculations for the Weighted Average Cost of Capital.
- Financial Ratios: Analyze Suning.com's profitability, leverage, and operational efficiency.
- Editable Inputs: Adjust variables such as growth rates, profit margins, and CAPEX to suit your analysis.
- Financial Statements: Access annual and quarterly reports for in-depth evaluation.
- Interactive Dashboard: Effortlessly visualize essential valuation metrics and outcomes.
Disclaimer
All information, articles, and product details provided on this website are for general informational and educational purposes only. We do not claim any ownership over, nor do we intend to infringe upon, any trademarks, copyrights, logos, brand names, or other intellectual property mentioned or depicted on this site. Such intellectual property remains the property of its respective owners, and any references here are made solely for identification or informational purposes, without implying any affiliation, endorsement, or partnership.
We make no representations or warranties, express or implied, regarding the accuracy, completeness, or suitability of any content or products presented. Nothing on this website should be construed as legal, tax, investment, financial, medical, or other professional advice. In addition, no part of this site—including articles or product references—constitutes a solicitation, recommendation, endorsement, advertisement, or offer to buy or sell any securities, franchises, or other financial instruments, particularly in jurisdictions where such activity would be unlawful.
All content is of a general nature and may not address the specific circumstances of any individual or entity. It is not a substitute for professional advice or services. Any actions you take based on the information provided here are strictly at your own risk. You accept full responsibility for any decisions or outcomes arising from your use of this website and agree to release us from any liability in connection with your use of, or reliance upon, the content or products found herein.