
|
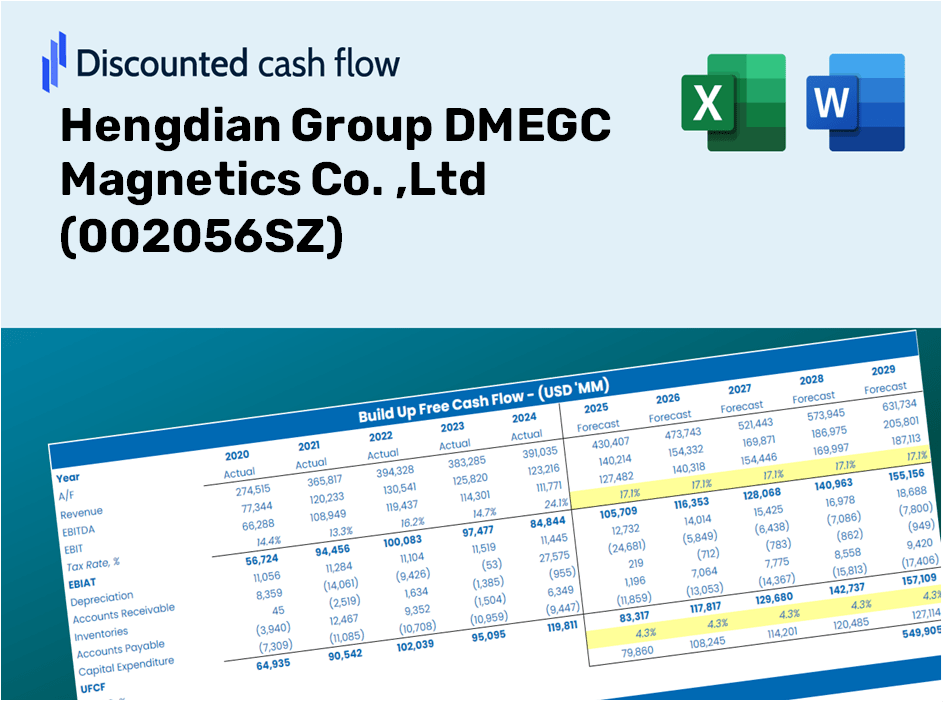
Hengdian Group DMEGC Magnetics Co., Ltd (002056.SZ) Évaluation DCF |
Entièrement Modifiable: Adapté À Vos Besoins Dans Excel Ou Sheets
Conception Professionnelle: Modèles Fiables Et Conformes Aux Normes Du Secteur
Pré-Construits Pour Une Utilisation Rapide Et Efficace
Compatible MAC/PC, entièrement débloqué
Aucune Expertise N'Est Requise; Facile À Suivre
Hengdian Group DMEGC Magnetics Co. ,Ltd (002056.SZ) Bundle
Vous cherchez à évaluer la valeur intrinsèque du groupe Hengdien DMEGC Magnetics Co., Ltd? Notre calculatrice DCF (002056SZ) fusionne les données réelles avec des fonctionnalités de personnalisation complètes, vous permettant d'affiner vos prévisions et d'améliorer vos choix d'investissement.
Discounted Cash Flow (DCF) - (USD MM)
| Year | AY1 2020 |
AY2 2021 |
AY3 2022 |
AY4 2023 |
AY5 2024 |
FY1 2025 |
FY2 2026 |
FY3 2027 |
FY4 2028 |
FY5 2029 |
|---|---|---|---|---|---|---|---|---|---|---|
| Revenue | 8,105.8 | 12,607.4 | 19,450.6 | 19,733.2 | 18,558.6 | 18,631.5 | 18,704.8 | 18,778.3 | 18,852.2 | 18,926.3 |
| Revenue Growth, % | 0 | 55.54 | 54.28 | 1.45 | -5.95 | 0.39317 | 0.39317 | 0.39317 | 0.39317 | 0.39317 |
| EBITDA | 1,275.2 | 1,446.7 | 2,112.9 | 2,789.0 | 2,650.3 | 2,477.4 | 2,487.1 | 2,496.9 | 2,506.7 | 2,516.6 |
| EBITDA, % | 15.73 | 11.48 | 10.86 | 14.13 | 14.28 | 13.3 | 13.3 | 13.3 | 13.3 | 13.3 |
| Depreciation | 393.2 | 406.8 | 461.4 | 560.2 | 642.7 | 624.2 | 626.7 | 629.1 | 631.6 | 634.1 |
| Depreciation, % | 4.85 | 3.23 | 2.37 | 2.84 | 3.46 | 3.35 | 3.35 | 3.35 | 3.35 | 3.35 |
| EBIT | 882.0 | 1,039.9 | 1,651.5 | 2,228.8 | 2,007.6 | 1,853.2 | 1,860.5 | 1,867.8 | 1,875.1 | 1,882.5 |
| EBIT, % | 10.88 | 8.25 | 8.49 | 11.29 | 10.82 | 9.95 | 9.95 | 9.95 | 9.95 | 9.95 |
| Total Cash | 3,887.2 | 3,956.8 | 6,485.9 | 9,189.2 | 8,976.7 | 7,736.6 | 7,767.1 | 7,797.6 | 7,828.3 | 7,859.0 |
| Total Cash, percent | .0 | .0 | .0 | .0 | .0 | .0 | .0 | .0 | .0 | .0 |
| Account Receivables | 1,925.4 | 2,322.3 | 2,934.7 | 3,085.3 | 3,500.3 | 3,419.2 | 3,432.6 | 3,446.1 | 3,459.7 | 3,473.3 |
| Account Receivables, % | 23.75 | 18.42 | 15.09 | 15.63 | 18.86 | 18.35 | 18.35 | 18.35 | 18.35 | 18.35 |
| Inventories | 885.1 | 1,744.7 | 2,036.3 | 1,954.8 | 3,748.7 | 2,434.5 | 2,444.1 | 2,453.7 | 2,463.3 | 2,473.0 |
| Inventories, % | 10.92 | 13.84 | 10.47 | 9.91 | 20.2 | 13.07 | 13.07 | 13.07 | 13.07 | 13.07 |
| Accounts Payable | 2,353.0 | 4,622.8 | 6,431.2 | 7,603.6 | 10,895.4 | 7,303.6 | 7,332.3 | 7,361.1 | 7,390.1 | 7,419.1 |
| Accounts Payable, % | 29.03 | 36.67 | 33.06 | 38.53 | 58.71 | 39.2 | 39.2 | 39.2 | 39.2 | 39.2 |
| Capital Expenditure | -683.2 | -1,012.7 | -1,478.4 | -1,725.3 | -1,129.5 | -1,449.2 | -1,454.9 | -1,460.6 | -1,466.4 | -1,472.1 |
| Capital Expenditure, % | -8.43 | -8.03 | -7.6 | -8.74 | -6.09 | -7.78 | -7.78 | -7.78 | -7.78 | -7.78 |
| Tax Rate, % | 13.98 | 13.98 | 13.98 | 13.98 | 13.98 | 13.98 | 13.98 | 13.98 | 13.98 | 13.98 |
| EBITAT | 798.3 | 949.8 | 1,661.3 | 1,950.2 | 1,727.0 | 1,687.7 | 1,694.4 | 1,701.0 | 1,707.7 | 1,714.4 |
| Depreciation | ||||||||||
| Changes in Account Receivables | ||||||||||
| Changes in Inventories | ||||||||||
| Changes in Accounts Payable | ||||||||||
| Capital Expenditure | ||||||||||
| UFCF | 50.7 | 1,357.2 | 1,548.7 | 1,888.4 | 2,323.1 | -1,333.8 | 871.8 | 875.2 | 878.7 | 882.1 |
| WACC, % | 5.35 | 5.35 | 5.36 | 5.34 | 5.34 | 5.35 | 5.35 | 5.35 | 5.35 | 5.35 |
| PV UFCF | ||||||||||
| SUM PV UFCF | 1,661.1 | |||||||||
| Long Term Growth Rate, % | 3.50 | |||||||||
| Free cash flow (T + 1) | 913 | |||||||||
| Terminal Value | 49,372 | |||||||||
| Present Terminal Value | 38,048 | |||||||||
| Enterprise Value | 39,709 | |||||||||
| Net Debt | -7,854 | |||||||||
| Equity Value | 47,563 | |||||||||
| Diluted Shares Outstanding, MM | 1,612 | |||||||||
| Equity Value Per Share | 29.51 |
What You Will Receive
- Pre-Filled Financial Model: Utilize Hengdian Group DMEGC Magnetics Co., Ltd's actual data for accurate DCF valuation.
- Comprehensive Forecast Control: Modify revenue growth, profit margins, WACC, and other essential parameters.
- Real-Time Calculations: Automatic updates let you see outcomes instantly as you make adjustments.
- Investor-Ready Template: A polished Excel file crafted for high-quality valuation.
- Customizable and Reusable: Designed for adaptability, enabling repeated application for in-depth forecasts.
Key Features
- Real-Life DMEGC Data: Pre-populated with Hengdian Group DMEGC Magnetics Co., Ltd's historical financial performance and future projections.
- Fully Customizable Inputs: Tailor metrics such as revenue growth, profit margins, WACC, tax rates, and capital expenditures.
- Dynamic Valuation Model: Automatically refreshes Net Present Value (NPV) and intrinsic value based on your input adjustments.
- Scenario Testing: Generate various forecast scenarios to explore different valuation results.
- User-Friendly Design: Intuitive layout crafted for both professionals and novices.
How It Works
- Step 1: Download the Excel file.
- Step 2: Examine Hengdian Group DMEGC Magnetics Co., Ltd's pre-filled financial data and projections.
- Step 3: Adjust key inputs such as revenue growth, WACC, and tax rates (highlighted cells).
- Step 4: Observe the DCF model refresh in real-time as you modify the assumptions.
- Step 5: Evaluate the results and apply them to your investment strategies.
Why Select This Calculator for Hengdian Group DMEGC Magnetics Co., Ltd (002056SZ)?
- User-Friendly Interface: Crafted for both novices and seasoned professionals.
- Customizable Inputs: Adjust parameters easily to suit your analytical needs.
- Real-Time Updates: Witness instant shifts in Hengdian Group's valuation as you modify inputs.
- Preloaded Data: Comes equipped with Hengdian Group’s actual financial details for swift assessments.
- Relied Upon by Experts: Favored by investors and analysts for informed decision-making.
Who Can Benefit from This Product?
- Investors: Evaluate Hengdian Group DMEGC Magnetics Co., Ltd's (002056SZ) valuation for informed trading decisions.
- CFOs and Financial Analysts: Enhance valuation methodologies and validate forecasts for better financial insights.
- Startup Founders: Gain insights into how established companies like Hengdian Group DMEGC are valued in the market.
- Consultants: Provide comprehensive valuation analyses and reports for your clients’ needs.
- Students and Educators: Utilize current data to practice and teach essential valuation strategies.
Contents of the Template
- Comprehensive DCF Model: An editable template featuring thorough valuation calculations.
- Real-World Data: Historical and projected financials for Hengdian Group DMEGC Magnetics Co., Ltd (002056SZ) preloaded for analysis.
- Customizable Parameters: Modify WACC, growth rates, and tax assumptions to explore different scenarios.
- Financial Statements: Complete annual and quarterly breakdowns for enhanced insights.
- Key Ratios: Integrated analysis focusing on profitability, efficiency, and leverage metrics.
- Dashboard with Visual Outputs: Clear charts and tables providing actionable insights.
Disclaimer
All information, articles, and product details provided on this website are for general informational and educational purposes only. We do not claim any ownership over, nor do we intend to infringe upon, any trademarks, copyrights, logos, brand names, or other intellectual property mentioned or depicted on this site. Such intellectual property remains the property of its respective owners, and any references here are made solely for identification or informational purposes, without implying any affiliation, endorsement, or partnership.
We make no representations or warranties, express or implied, regarding the accuracy, completeness, or suitability of any content or products presented. Nothing on this website should be construed as legal, tax, investment, financial, medical, or other professional advice. In addition, no part of this site—including articles or product references—constitutes a solicitation, recommendation, endorsement, advertisement, or offer to buy or sell any securities, franchises, or other financial instruments, particularly in jurisdictions where such activity would be unlawful.
All content is of a general nature and may not address the specific circumstances of any individual or entity. It is not a substitute for professional advice or services. Any actions you take based on the information provided here are strictly at your own risk. You accept full responsibility for any decisions or outcomes arising from your use of this website and agree to release us from any liability in connection with your use of, or reliance upon, the content or products found herein.