
|
Hunan Nanling Industrial Explosive Materials Co., Ltd. (002096.SZ) Valation DCF |
Entièrement Modifiable: Adapté À Vos Besoins Dans Excel Ou Sheets
Conception Professionnelle: Modèles Fiables Et Conformes Aux Normes Du Secteur
Pré-Construits Pour Une Utilisation Rapide Et Efficace
Compatible MAC/PC, entièrement débloqué
Aucune Expertise N'Est Requise; Facile À Suivre
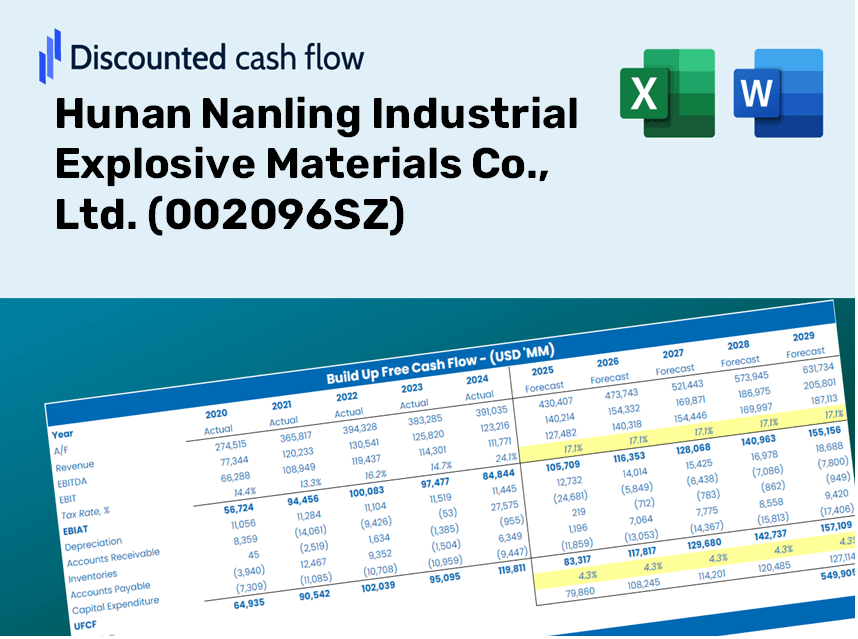
Hunan Nanling Industrial Explosive Materials Co., Ltd. (002096.SZ) Bundle
Conçu pour la précision, notre calculatrice DCF (002096SZ) vous permet d'évaluer l'évaluation de Hunan Nanling Industrial Explosive Materials Co., Ltd. à l'aide de données financières réelles et offre une flexibilité complète pour modifier tous les paramètres essentiels pour des projections améliorées.
Discounted Cash Flow (DCF) - (USD MM)
| Year | AY1 2020 |
AY2 2021 |
AY3 2022 |
AY4 2023 |
AY5 2024 |
FY1 2025 |
FY2 2026 |
FY3 2027 |
FY4 2028 |
FY5 2029 |
|---|---|---|---|---|---|---|---|---|---|---|
| Revenue | 2,001.6 | 1,930.9 | 2,304.2 | 8,427.7 | 8,545.9 | 11,049.8 | 14,287.4 | 18,473.7 | 23,886.5 | 30,885.3 |
| Revenue Growth, % | 0 | -3.53 | 19.33 | 265.75 | 1.4 | 29.3 | 29.3 | 29.3 | 29.3 | 29.3 |
| EBITDA | 207.0 | 160.7 | 168.7 | 1,046.9 | 1,123.2 | 1,139.2 | 1,473.0 | 1,904.6 | 2,462.7 | 3,184.3 |
| EBITDA, % | 10.34 | 8.32 | 7.32 | 12.42 | 13.14 | 10.31 | 10.31 | 10.31 | 10.31 | 10.31 |
| Depreciation | 80.7 | 85.1 | 87.6 | 237.1 | 252.4 | 398.0 | 514.6 | 665.4 | 860.3 | 1,112.4 |
| Depreciation, % | 4.03 | 4.41 | 3.8 | 2.81 | 2.95 | 3.6 | 3.6 | 3.6 | 3.6 | 3.6 |
| EBIT | 126.3 | 75.5 | 81.2 | 809.8 | 870.8 | 741.3 | 958.4 | 1,239.3 | 1,602.4 | 2,071.9 |
| EBIT, % | 6.31 | 3.91 | 3.52 | 9.61 | 10.19 | 6.71 | 6.71 | 6.71 | 6.71 | 6.71 |
| Total Cash | 709.8 | 481.4 | 494.4 | 2,672.7 | 2,753.3 | 3,221.7 | 4,165.6 | 5,386.1 | 6,964.3 | 9,004.8 |
| Total Cash, percent | .0 | .0 | .0 | .0 | .0 | .0 | .0 | .0 | .0 | .0 |
| Account Receivables | 543.2 | 584.5 | 654.6 | 2,502.2 | 2,832.1 | 3,284.9 | 4,247.4 | 5,491.8 | 7,101.0 | 9,181.6 |
| Account Receivables, % | 27.14 | 30.27 | 28.41 | 29.69 | 33.14 | 29.73 | 29.73 | 29.73 | 29.73 | 29.73 |
| Inventories | 267.9 | 816.6 | 342.9 | 454.2 | 433.4 | 1,790.4 | 2,315.0 | 2,993.3 | 3,870.4 | 5,004.4 |
| Inventories, % | 13.38 | 42.29 | 14.88 | 5.39 | 5.07 | 16.2 | 16.2 | 16.2 | 16.2 | 16.2 |
| Accounts Payable | 300.5 | 280.9 | 665.7 | 1,049.3 | 1,187.3 | 1,873.9 | 2,422.9 | 3,132.8 | 4,050.7 | 5,237.6 |
| Accounts Payable, % | 15.01 | 14.55 | 28.89 | 12.45 | 13.89 | 16.96 | 16.96 | 16.96 | 16.96 | 16.96 |
| Capital Expenditure | -104.4 | -107.8 | -55.4 | -182.8 | -285.4 | -413.6 | -534.8 | -691.5 | -894.1 | -1,156.0 |
| Capital Expenditure, % | -5.22 | -5.58 | -2.41 | -2.17 | -3.34 | -3.74 | -3.74 | -3.74 | -3.74 | -3.74 |
| Tax Rate, % | 21.11 | 21.11 | 21.11 | 21.11 | 21.11 | 21.11 | 21.11 | 21.11 | 21.11 | 21.11 |
| EBITAT | 122.5 | 71.0 | 48.3 | 626.9 | 687.0 | 603.2 | 780.0 | 1,008.5 | 1,304.0 | 1,686.1 |
| Depreciation | ||||||||||
| Changes in Account Receivables | ||||||||||
| Changes in Inventories | ||||||||||
| Changes in Accounts Payable | ||||||||||
| Capital Expenditure | ||||||||||
| UFCF | -411.7 | -561.3 | 868.9 | -894.0 | 482.9 | -535.7 | -178.2 | -230.4 | -298.0 | -385.3 |
| WACC, % | 5.75 | 5.75 | 5.7 | 5.72 | 5.73 | 5.73 | 5.73 | 5.73 | 5.73 | 5.73 |
| PV UFCF | ||||||||||
| SUM PV UFCF | -1,391.1 | |||||||||
| Long Term Growth Rate, % | 4.00 | |||||||||
| Free cash flow (T + 1) | -401 | |||||||||
| Terminal Value | -23,171 | |||||||||
| Present Terminal Value | -17,538 | |||||||||
| Enterprise Value | -18,929 | |||||||||
| Net Debt | -2,453 | |||||||||
| Equity Value | -16,476 | |||||||||
| Diluted Shares Outstanding, MM | 1,251 | |||||||||
| Equity Value Per Share | -13.17 |
What You Will Receive
- Authentic Hunan Nanling Financials: Access to historical and projected data for precise valuation.
- Customizable Inputs: Adjust parameters such as WACC, tax rates, revenue growth, and capital expenditures.
- Real-Time Calculations: Intrinsic value and NPV are computed automatically.
- Scenario Analysis: Evaluate various scenarios to assess the future performance of Hunan Nanling.
- User-Friendly Design: Designed for professionals while remaining accessible to newcomers.
Key Features
- Comprehensive Historical Data: Access Hunan Nanling Industrial Explosive Materials Co., Ltd.'s (002096SZ) extensive financial history and forecasts.
- Customizable Parameters: Modify WACC, tax rates, revenue growth projections, and EBITDA margins to suit your analysis.
- Real-Time Insights: Observe the recalculation of Hunan Nanling's (002096SZ) intrinsic value instantly.
- Intuitive Visualizations: Interactive dashboard charts showcase valuation results and essential metrics clearly.
- Designed for Precision: A robust tool tailored for analysts, investors, and finance professionals.
How It Functions
- 1. Access the Template: Download and open the Excel file featuring Hunan Nanling Industrial Explosive Materials Co., Ltd.'s preloaded data.
- 2. Modify Assumptions: Adjust critical inputs such as growth rates, WACC, and capital expenditures.
- 3. View Results in Real-Time: The DCF model automatically calculates intrinsic value and NPV.
- 4. Explore Scenarios: Analyze various forecasts to evaluate different valuation scenarios.
- 5. Present with Assurance: Deliver professional valuation insights to bolster your decision-making process.
Why Choose Our Financial Calculator for Hunan Nanling Industrial Explosive Materials Co., Ltd. (002096SZ)?
- All-in-One Solution: Combines DCF, WACC, and financial ratio assessments for comprehensive analysis.
- Flexible Customization: Modify the yellow-highlighted cells to explore different financial scenarios.
- In-Depth Analysis: Automatically computes the intrinsic value and Net Present Value for Hunan Nanling (002096SZ).
- Built-In Data: Features historical and projected data for precise evaluations.
- Expert-Level Quality: Perfect for financial analysts, investors, and consulting professionals.
Who Should Consider Hunan Nanling Industrial Explosive Materials Co., Ltd. (002096SZ)?
- Engineering Students: Discover practical applications of explosive materials in various industries.
- Researchers: Integrate advanced explosive technologies into academic studies and projects.
- Investors: Evaluate market trends and investment opportunities related to explosive material production.
- Industry Analysts: Enhance your analysis with comprehensive data on Hunan Nanling's performance and market positioning.
- Manufacturers: Learn from the operational strategies of a leading company in the explosive materials sector.
Contents of the Template
- Pre-Filled Data: Contains Hunan Nanling Industrial Explosive Materials Co., Ltd.'s historical financial information and projections.
- Discounted Cash Flow Model: A customizable DCF valuation model with automated calculations.
- Weighted Average Cost of Capital (WACC): A specialized sheet for calculating WACC based on user-defined inputs.
- Key Financial Ratios: Evaluate Hunan Nanling's profitability, efficiency, and financial leverage.
- Customizable Inputs: Easily modify revenue growth rates, profit margins, and tax rates.
- Clear Dashboard: Visual summaries including charts and tables that highlight essential valuation outcomes.
Disclaimer
All information, articles, and product details provided on this website are for general informational and educational purposes only. We do not claim any ownership over, nor do we intend to infringe upon, any trademarks, copyrights, logos, brand names, or other intellectual property mentioned or depicted on this site. Such intellectual property remains the property of its respective owners, and any references here are made solely for identification or informational purposes, without implying any affiliation, endorsement, or partnership.
We make no representations or warranties, express or implied, regarding the accuracy, completeness, or suitability of any content or products presented. Nothing on this website should be construed as legal, tax, investment, financial, medical, or other professional advice. In addition, no part of this site—including articles or product references—constitutes a solicitation, recommendation, endorsement, advertisement, or offer to buy or sell any securities, franchises, or other financial instruments, particularly in jurisdictions where such activity would be unlawful.
All content is of a general nature and may not address the specific circumstances of any individual or entity. It is not a substitute for professional advice or services. Any actions you take based on the information provided here are strictly at your own risk. You accept full responsibility for any decisions or outcomes arising from your use of this website and agree to release us from any liability in connection with your use of, or reliance upon, the content or products found herein.