
|
Guangdong Hongtu Technology Co., Ltd. (002101.SZ) Évaluation DCF |
Entièrement Modifiable: Adapté À Vos Besoins Dans Excel Ou Sheets
Conception Professionnelle: Modèles Fiables Et Conformes Aux Normes Du Secteur
Pré-Construits Pour Une Utilisation Rapide Et Efficace
Compatible MAC/PC, entièrement débloqué
Aucune Expertise N'Est Requise; Facile À Suivre
Guangdong Hongtu Technology (holdings) Co.,Ltd. (002101.SZ) Bundle
Explorez les perspectives financières de Guangdong Hongtu Technology (Holdings) Co., Ltd. (002101SZ) avec notre calculatrice DCF conviviale! Entrez vos hypothèses de croissance, de marges et de dépenses pour déterminer la valeur intrinsèque de la technologie Guangdong Hongtu (Holdings) Co., Ltd. (002101SZ) et affinez votre stratégie d'investissement.
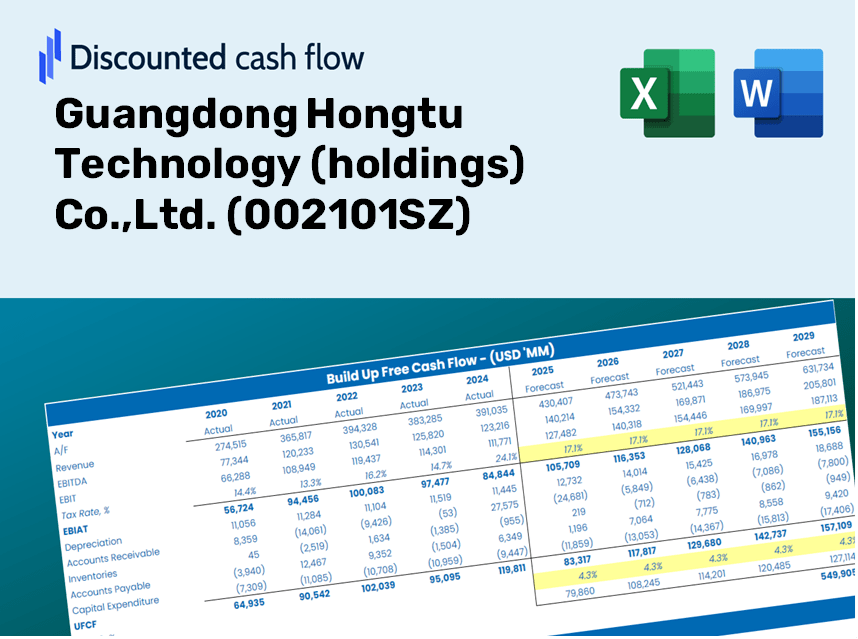
Discounted Cash Flow (DCF) - (USD MM)
| Year | AY1 2020 |
AY2 2021 |
AY3 2022 |
AY4 2023 |
AY5 2024 |
FY1 2025 |
FY2 2026 |
FY3 2027 |
FY4 2028 |
FY5 2029 |
|---|---|---|---|---|---|---|---|---|---|---|
| Revenue | 5,596.0 | 6,003.3 | 6,671.7 | 7,614.5 | 8,053.2 | 8,824.4 | 9,669.5 | 10,595.4 | 11,610.1 | 12,721.9 |
| Revenue Growth, % | 0 | 7.28 | 11.13 | 14.13 | 5.76 | 9.58 | 9.58 | 9.58 | 9.58 | 9.58 |
| EBITDA | 540.9 | 664.8 | 731.6 | 816.1 | 784.9 | 920.7 | 1,008.8 | 1,105.5 | 1,211.3 | 1,327.3 |
| EBITDA, % | 9.66 | 11.07 | 10.97 | 10.72 | 9.75 | 10.43 | 10.43 | 10.43 | 10.43 | 10.43 |
| Depreciation | 292.5 | 286.7 | 311.4 | 350.9 | 391.8 | 426.1 | 466.9 | 511.6 | 560.6 | 614.3 |
| Depreciation, % | 5.23 | 4.78 | 4.67 | 4.61 | 4.86 | 4.83 | 4.83 | 4.83 | 4.83 | 4.83 |
| EBIT | 248.3 | 378.1 | 420.2 | 465.1 | 393.1 | 494.6 | 541.9 | 593.8 | 650.7 | 713.0 |
| EBIT, % | 4.44 | 6.3 | 6.3 | 6.11 | 4.88 | 5.6 | 5.6 | 5.6 | 5.6 | 5.6 |
| Total Cash | 658.4 | 433.8 | 461.1 | 2,832.9 | 2,738.0 | 1,713.8 | 1,877.9 | 2,057.8 | 2,254.8 | 2,470.8 |
| Total Cash, percent | .0 | .0 | .0 | .0 | .0 | .0 | .0 | .0 | .0 | .0 |
| Account Receivables | 1,854.4 | 1,717.0 | 2,170.5 | 2,867.2 | 3,385.7 | 3,070.3 | 3,364.3 | 3,686.5 | 4,039.5 | 4,426.4 |
| Account Receivables, % | 33.14 | 28.6 | 32.53 | 37.65 | 42.04 | 34.79 | 34.79 | 34.79 | 34.79 | 34.79 |
| Inventories | 895.6 | 914.1 | 1,224.8 | 1,195.2 | 1,445.3 | 1,469.0 | 1,609.6 | 1,763.8 | 1,932.7 | 2,117.7 |
| Inventories, % | 16 | 15.23 | 18.36 | 15.7 | 17.95 | 16.65 | 16.65 | 16.65 | 16.65 | 16.65 |
| Accounts Payable | 1,832.4 | 1,517.9 | 1,473.3 | 3,083.1 | 4,417.5 | 3,096.6 | 3,393.1 | 3,718.1 | 4,074.1 | 4,464.3 |
| Accounts Payable, % | 32.74 | 25.28 | 22.08 | 40.49 | 54.85 | 35.09 | 35.09 | 35.09 | 35.09 | 35.09 |
| Capital Expenditure | -435.2 | -482.6 | -646.4 | -794.8 | -903.0 | -832.3 | -912.0 | -999.3 | -1,095.0 | -1,199.9 |
| Capital Expenditure, % | -7.78 | -8.04 | -9.69 | -10.44 | -11.21 | -9.43 | -9.43 | -9.43 | -9.43 | -9.43 |
| Tax Rate, % | 7.6 | 7.6 | 7.6 | 7.6 | 7.6 | 7.6 | 7.6 | 7.6 | 7.6 | 7.6 |
| EBITAT | 182.6 | 299.1 | 390.4 | 419.0 | 363.2 | 423.4 | 463.9 | 508.4 | 557.1 | 610.4 |
| Depreciation | ||||||||||
| Changes in Account Receivables | ||||||||||
| Changes in Inventories | ||||||||||
| Changes in Accounts Payable | ||||||||||
| Capital Expenditure | ||||||||||
| UFCF | -877.7 | -92.5 | -753.4 | 917.8 | 417.7 | -1,012.0 | -119.3 | -130.7 | -143.2 | -156.9 |
| WACC, % | 4.66 | 4.69 | 4.76 | 4.75 | 4.76 | 4.72 | 4.72 | 4.72 | 4.72 | 4.72 |
| PV UFCF | ||||||||||
| SUM PV UFCF | -1,432.6 | |||||||||
| Long Term Growth Rate, % | 3.00 | |||||||||
| Free cash flow (T + 1) | -162 | |||||||||
| Terminal Value | -9,383 | |||||||||
| Present Terminal Value | -7,450 | |||||||||
| Enterprise Value | -8,882 | |||||||||
| Net Debt | -2,218 | |||||||||
| Equity Value | -6,664 | |||||||||
| Diluted Shares Outstanding, MM | 659 | |||||||||
| Equity Value Per Share | -10.11 |
What You Will Receive
- Authentic 002101SZ Financial Data: Pre-loaded with Guangdong Hongtu Technology’s historical and forecasted data for accurate analysis.
- Completely Customizable Template: Easily adjust essential inputs such as revenue growth, WACC, and EBITDA percentage.
- Instant Calculations: Observe real-time updates of Guangdong Hongtu Technology’s intrinsic value as you make adjustments.
- Expert Valuation Tool: Tailored for investors, analysts, and consultants aiming for precise DCF outcomes.
- Intuitive Design: A straightforward layout and clear guidance suitable for all levels of expertise.
Key Features
- Comprehensive Historical Data: Pre-loaded with Guangdong Hongtu Technology's (002101SZ) past financial performance and outlook.
- Customizable Financial Inputs: Tailor revenue growth rates, profit margins, discount rates (WACC), tax implications, and capital investment assumptions.
- Real-Time Valuation Model: Automatic recalculations of Net Present Value (NPV) and intrinsic value based on your customized inputs.
- Scenario Analysis: Develop various forecasting scenarios to explore different potential valuation outcomes.
- Intuitive Interface: Clean, organized design suitable for both seasoned professionals and newcomers.
How It Works
- 1. Access the Template: Download and open the Excel file containing Guangdong Hongtu Technology (holdings) Co., Ltd. (002101SZ)'s preloaded financial data.
- 2. Adjust Parameters: Modify key inputs such as growth rates, WACC, and capital expenditures to fit your analysis.
- 3. View Immediate Results: The DCF model automatically calculates intrinsic value and NPV based on your inputs.
- 4. Explore Different Scenarios: Analyze various forecasts to evaluate different valuation scenarios.
- 5. Present with Assurance: Share detailed valuation insights to bolster your decision-making process.
Why Choose This Calculator for Guangdong Hongtu Technology (002101SZ)?
- Data Integrity: Utilizes accurate financial data from Guangdong Hongtu Technology.
- Adaptive Features: Tailored for users to easily experiment with and adjust inputs.
- Efficiency Boost: Eliminate the complexity of creating a DCF model from the ground up.
- High Standard: Crafted with the precision and functionality expected by financial professionals.
- Intuitive Design: Simple to navigate, even for those with limited financial modeling experience.
Who Should Utilize This Product?
- Investors: Accurately assess the fair value of Guangdong Hongtu Technology (holdings) Co.,Ltd. (002101SZ) before making any investment choices.
- CFOs: Utilize a sophisticated DCF model for financial reporting and analysis tailored for Guangdong Hongtu Technology (holdings) Co.,Ltd. (002101SZ).
- Consultants: Efficiently customize the template for valuation reports concerning clients with interests in Guangdong Hongtu Technology (holdings) Co.,Ltd. (002101SZ).
- Entrepreneurs: Acquire insights into the financial modeling techniques employed by leading companies, including Guangdong Hongtu Technology (holdings) Co.,Ltd. (002101SZ).
- Educators: Apply it as a teaching resource to illustrate valuation methodologies relevant to Guangdong Hongtu Technology (holdings) Co.,Ltd. (002101SZ).
Overview of Template Features
- Comprehensive DCF Model: An editable template that includes detailed valuation calculations.
- Real-World Data: Historical and projected financials for Guangdong Hongtu Technology (holdings) Co.,Ltd. (002101SZ) preloaded for in-depth analysis.
- Customizable Parameters: Modify WACC, growth rates, and tax assumptions to explore various scenarios.
- Financial Statements: Complete annual and quarterly breakdowns for enhanced insights.
- Key Ratios: Integrated analysis for profitability, efficiency, and leverage metrics.
- Dashboard with Visual Outputs: Charts and tables designed to present clear and actionable results.
Disclaimer
All information, articles, and product details provided on this website are for general informational and educational purposes only. We do not claim any ownership over, nor do we intend to infringe upon, any trademarks, copyrights, logos, brand names, or other intellectual property mentioned or depicted on this site. Such intellectual property remains the property of its respective owners, and any references here are made solely for identification or informational purposes, without implying any affiliation, endorsement, or partnership.
We make no representations or warranties, express or implied, regarding the accuracy, completeness, or suitability of any content or products presented. Nothing on this website should be construed as legal, tax, investment, financial, medical, or other professional advice. In addition, no part of this site—including articles or product references—constitutes a solicitation, recommendation, endorsement, advertisement, or offer to buy or sell any securities, franchises, or other financial instruments, particularly in jurisdictions where such activity would be unlawful.
All content is of a general nature and may not address the specific circumstances of any individual or entity. It is not a substitute for professional advice or services. Any actions you take based on the information provided here are strictly at your own risk. You accept full responsibility for any decisions or outcomes arising from your use of this website and agree to release us from any liability in connection with your use of, or reliance upon, the content or products found herein.