
|
Shenzhen Laibao Hi-Tech Co., Ltd. (002106.SZ) Valation DCF |
Entièrement Modifiable: Adapté À Vos Besoins Dans Excel Ou Sheets
Conception Professionnelle: Modèles Fiables Et Conformes Aux Normes Du Secteur
Pré-Construits Pour Une Utilisation Rapide Et Efficace
Compatible MAC/PC, entièrement débloqué
Aucune Expertise N'Est Requise; Facile À Suivre
Shenzhen Laibao Hi-Tech Co., Ltd. (002106.SZ) Bundle
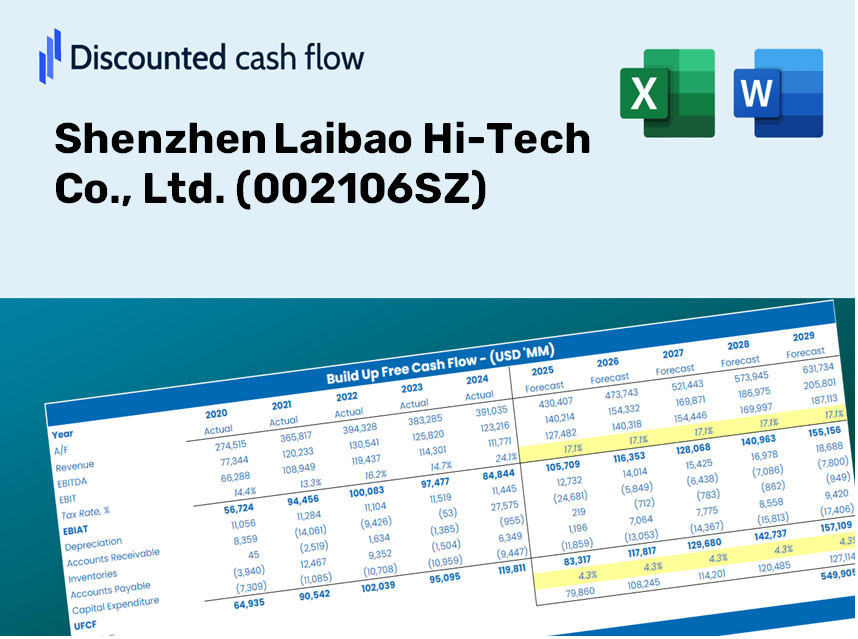
Gardez un aperçu de votre analyse d'évaluation de votre Shenzhen Laibao Hi-Tech Co., Ltd. (002106SZ) avec notre calculatrice sophistiquée DCF! Équipé de données à jour (002106SZ), ce modèle Excel vous permet d'ajuster les prévisions et les hypothèses, vous permettant de déterminer la valeur intrinsèque de Shenzhen Laibao Hi-Tech Co., Ltd.
Discounted Cash Flow (DCF) - (USD MM)
| Year | AY1 2020 |
AY2 2021 |
AY3 2022 |
AY4 2023 |
AY5 2024 |
FY1 2025 |
FY2 2026 |
FY3 2027 |
FY4 2028 |
FY5 2029 |
|---|---|---|---|---|---|---|---|---|---|---|
| Revenue | 6,751.5 | 7,682.3 | 6,153.5 | 5,585.9 | 5,895.6 | 5,751.2 | 5,610.4 | 5,473.0 | 5,339.0 | 5,208.3 |
| Revenue Growth, % | 0 | 13.79 | -19.9 | -9.22 | 5.54 | -2.45 | -2.45 | -2.45 | -2.45 | -2.45 |
| EBITDA | 754.0 | 656.7 | 560.4 | 616.3 | 658.6 | 586.9 | 572.6 | 558.5 | 544.9 | 531.5 |
| EBITDA, % | 11.17 | 8.55 | 9.11 | 11.03 | 11.17 | 10.21 | 10.21 | 10.21 | 10.21 | 10.21 |
| Depreciation | 161.4 | 161.9 | 172.1 | 195.1 | 199.6 | 163.0 | 159.0 | 155.1 | 151.3 | 147.6 |
| Depreciation, % | 2.39 | 2.11 | 2.8 | 3.49 | 3.39 | 2.83 | 2.83 | 2.83 | 2.83 | 2.83 |
| EBIT | 592.7 | 494.8 | 388.3 | 421.3 | 459.0 | 423.9 | 413.5 | 403.4 | 393.5 | 383.9 |
| EBIT, % | 8.78 | 6.44 | 6.31 | 7.54 | 7.79 | 7.37 | 7.37 | 7.37 | 7.37 | 7.37 |
| Total Cash | 2,003.0 | 2,352.5 | 2,676.0 | 3,023.8 | 4,347.1 | 2,664.5 | 2,599.2 | 2,535.6 | 2,473.5 | 2,412.9 |
| Total Cash, percent | .0 | .0 | .0 | .0 | .0 | .0 | .0 | .0 | .0 | .0 |
| Account Receivables | 2,130.9 | 2,006.8 | 1,423.3 | 1,432.5 | 1,534.9 | 1,524.0 | 1,486.7 | 1,450.3 | 1,414.8 | 1,380.1 |
| Account Receivables, % | 31.56 | 26.12 | 23.13 | 25.65 | 26.03 | 26.5 | 26.5 | 26.5 | 26.5 | 26.5 |
| Inventories | 652.9 | 831.6 | 585.0 | 561.9 | 558.0 | 569.7 | 555.7 | 542.1 | 528.8 | 515.9 |
| Inventories, % | 9.67 | 10.83 | 9.51 | 10.06 | 9.46 | 9.91 | 9.91 | 9.91 | 9.91 | 9.91 |
| Accounts Payable | 1,302.9 | 1,348.8 | 787.3 | 976.3 | 714.7 | 911.6 | 889.2 | 867.5 | 846.2 | 825.5 |
| Accounts Payable, % | 19.3 | 17.56 | 12.79 | 17.48 | 12.12 | 15.85 | 15.85 | 15.85 | 15.85 | 15.85 |
| Capital Expenditure | -51.5 | -178.3 | -409.9 | -210.7 | -2,004.7 | -546.6 | -533.2 | -520.2 | -507.4 | -495.0 |
| Capital Expenditure, % | -0.76278 | -2.32 | -6.66 | -3.77 | -34 | -9.5 | -9.5 | -9.5 | -9.5 | -9.5 |
| Tax Rate, % | 4.76 | 4.76 | 4.76 | 4.76 | 4.76 | 4.76 | 4.76 | 4.76 | 4.76 | 4.76 |
| EBITAT | 526.3 | 489.2 | 366.4 | 374.7 | 437.1 | 395.3 | 385.6 | 376.2 | 367.0 | 358.0 |
| Depreciation | ||||||||||
| Changes in Account Receivables | ||||||||||
| Changes in Inventories | ||||||||||
| Changes in Accounts Payable | ||||||||||
| Capital Expenditure | ||||||||||
| UFCF | -844.7 | 464.1 | 397.1 | 562.0 | -1,728.0 | 207.7 | 40.4 | 39.4 | 38.4 | 37.5 |
| WACC, % | 6.29 | 6.36 | 6.33 | 6.29 | 6.34 | 6.32 | 6.32 | 6.32 | 6.32 | 6.32 |
| PV UFCF | ||||||||||
| SUM PV UFCF | 321.5 | |||||||||
| Long Term Growth Rate, % | 3.50 | |||||||||
| Free cash flow (T + 1) | 39 | |||||||||
| Terminal Value | 1,375 | |||||||||
| Present Terminal Value | 1,012 | |||||||||
| Enterprise Value | 1,334 | |||||||||
| Net Debt | -4,341 | |||||||||
| Equity Value | 5,675 | |||||||||
| Diluted Shares Outstanding, MM | 706 | |||||||||
| Equity Value Per Share | 8.04 |
What You Will Receive
- Authentic Shenzhen Laibao Data: Preloaded financials – encompassing revenue to EBIT – derived from actual and forecasted figures.
- Comprehensive Customization: Modify all key parameters (yellow cells) such as WACC, growth %, and tax rates.
- Real-Time Valuation Updates: Automatic recalculations to assess the effects of changes on Shenzhen Laibao's fair value.
- Dynamic Excel Template: Designed for seamless edits, scenario analysis, and in-depth projections.
- Efficient and Precise: Eliminate the need to construct models from scratch while ensuring accuracy and adaptability.
Key Features
- Real-Life 002106SZ Data: Pre-loaded with Shenzhen Laibao Hi-Tech’s historical financial metrics and future projections.
- Fully Customizable Inputs: Tailor revenue growth, profit margins, WACC, tax rates, and capital expenditures to suit your analysis.
- Dynamic Valuation Model: Instant updates to Net Present Value (NPV) and intrinsic value reflecting your input adjustments.
- Scenario Testing: Develop multiple forecasting scenarios to explore various valuation possibilities.
- User-Friendly Design: Intuitive, organized layout suitable for both professionals and novices.
How It Works
- Download: Get the fully-prepared Excel file containing Shenzhen Laibao Hi-Tech Co., Ltd.'s (002106SZ) financial data.
- Customize: Modify projections such as revenue growth, EBITDA %, and WACC to fit your analysis.
- Update Automatically: Watch as intrinsic value and NPV calculations refresh in real-time.
- Test Scenarios: Generate various forecasts and instantly compare their results.
- Make Decisions: Leverage the valuation insights to shape your investment approach.
Why Opt for This Calculator?
- User-Friendly Interface: Suitable for both novices and experienced users.
- Customizable Inputs: Effortlessly adjust parameters to tailor your analysis.
- Real-Time Updates: Observe immediate changes in Shenzhen Laibao Hi-Tech Co., Ltd.'s (002106SZ) valuation as you modify inputs.
- Pre-Configured Data: Comes with Shenzhen Laibao's actual financial metrics for quick insights.
- Endorsed by Experts: Valued by investors and analysts for making well-informed choices.
Who Can Benefit from This Product?
- Professional Investors: Develop precise and dependable valuation models for in-depth portfolio analysis of Shenzhen Laibao Hi-Tech Co., Ltd. (002106SZ).
- Corporate Finance Teams: Evaluate valuation scenarios to inform strategic planning within your organization.
- Consultants and Advisors: Deliver accurate valuation insights for clients interested in Shenzhen Laibao Hi-Tech Co., Ltd. (002106SZ).
- Students and Educators: Utilize real-world data for practicing and teaching financial modeling concepts.
- Tech Enthusiasts: Gain insights into the market valuation of technology companies like Shenzhen Laibao Hi-Tech Co., Ltd. (002106SZ).
Contents of the Template
- Operating and Balance Sheet Data: Pre-filled Shenzhen Laibao Hi-Tech Co., Ltd. historical data and forecasts, including revenue, EBITDA, EBIT, and capital expenditures.
- WACC Calculation: A dedicated sheet for Weighted Average Cost of Capital (WACC), featuring parameters such as Beta, risk-free rate, and share price.
- DCF Valuation (Unlevered and Levered): Customizable Discounted Cash Flow models demonstrating intrinsic value with detailed calculations.
- Financial Statements: Pre-loaded financial statements (annual and quarterly) to facilitate analysis.
- Key Ratios: Includes profitability, leverage, and efficiency ratios for Shenzhen Laibao Hi-Tech Co., Ltd. (002106SZ).
- Dashboard and Charts: Visual overview of valuation outputs and assumptions for easy analysis of results.
Disclaimer
All information, articles, and product details provided on this website are for general informational and educational purposes only. We do not claim any ownership over, nor do we intend to infringe upon, any trademarks, copyrights, logos, brand names, or other intellectual property mentioned or depicted on this site. Such intellectual property remains the property of its respective owners, and any references here are made solely for identification or informational purposes, without implying any affiliation, endorsement, or partnership.
We make no representations or warranties, express or implied, regarding the accuracy, completeness, or suitability of any content or products presented. Nothing on this website should be construed as legal, tax, investment, financial, medical, or other professional advice. In addition, no part of this site—including articles or product references—constitutes a solicitation, recommendation, endorsement, advertisement, or offer to buy or sell any securities, franchises, or other financial instruments, particularly in jurisdictions where such activity would be unlawful.
All content is of a general nature and may not address the specific circumstances of any individual or entity. It is not a substitute for professional advice or services. Any actions you take based on the information provided here are strictly at your own risk. You accept full responsibility for any decisions or outcomes arising from your use of this website and agree to release us from any liability in connection with your use of, or reliance upon, the content or products found herein.