
|
Sansteel Minguang Co., Ltd., Fujian (002110.SZ) Valation DCF |
Entièrement Modifiable: Adapté À Vos Besoins Dans Excel Ou Sheets
Conception Professionnelle: Modèles Fiables Et Conformes Aux Normes Du Secteur
Pré-Construits Pour Une Utilisation Rapide Et Efficace
Compatible MAC/PC, entièrement débloqué
Aucune Expertise N'Est Requise; Facile À Suivre
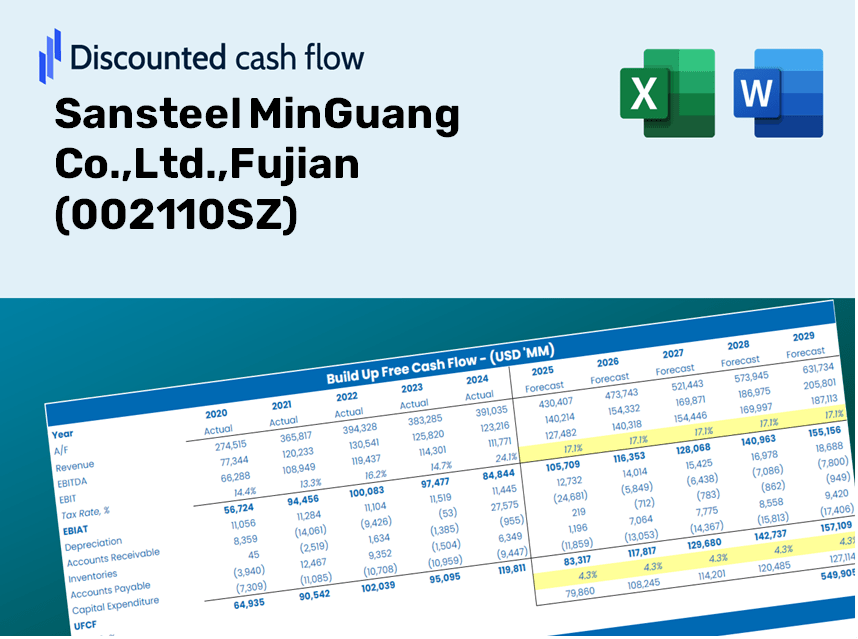
Sansteel MinGuang Co.,Ltd.,Fujian (002110.SZ) Bundle
Que vous soyez un investisseur ou un analyste, cette calculatrice DCF (002110SZ) est votre ressource incontournable pour une évaluation précise. Préchargé avec des données réelles de Sansteel Minguang Co., Ltd., Fujian, vous pouvez ajuster les prévisions et observer les effets instantanément.
Discounted Cash Flow (DCF) - (USD MM)
| Year | AY1 2020 |
AY2 2021 |
AY3 2022 |
AY4 2023 |
AY5 2024 |
FY1 2025 |
FY2 2026 |
FY3 2027 |
FY4 2028 |
FY5 2029 |
|---|---|---|---|---|---|---|---|---|---|---|
| Revenue | 48,636.3 | 62,753.0 | 51,658.0 | 47,940.8 | 46,058.4 | 50,097.7 | 54,491.2 | 59,270.0 | 64,467.9 | 70,121.6 |
| Revenue Growth, % | 0 | 29.02 | -17.68 | -7.2 | -3.93 | 8.77 | 8.77 | 8.77 | 8.77 | 8.77 |
| EBITDA | 4,887.3 | 6,787.6 | 1,654.4 | 1,377.0 | 1,099.9 | 2,938.5 | 3,196.2 | 3,476.5 | 3,781.4 | 4,113.0 |
| EBITDA, % | 10.05 | 10.82 | 3.2 | 2.87 | 2.39 | 5.87 | 5.87 | 5.87 | 5.87 | 5.87 |
| Depreciation | 1,177.7 | 1,210.0 | 1,208.7 | 1,376.5 | 1,600.0 | 1,306.0 | 1,420.5 | 1,545.1 | 1,680.6 | 1,828.0 |
| Depreciation, % | 2.42 | 1.93 | 2.34 | 2.87 | 3.47 | 2.61 | 2.61 | 2.61 | 2.61 | 2.61 |
| EBIT | 3,709.6 | 5,577.7 | 445.7 | .5 | -500.2 | 1,632.5 | 1,775.7 | 1,931.4 | 2,100.8 | 2,285.0 |
| EBIT, % | 7.63 | 8.89 | 0.86271 | 0.00114552 | -1.09 | 3.26 | 3.26 | 3.26 | 3.26 | 3.26 |
| Total Cash | 9,845.3 | 9,131.6 | 6,836.0 | 6,709.0 | 7,823.7 | 7,916.3 | 8,610.5 | 9,365.6 | 10,187.0 | 11,080.4 |
| Total Cash, percent | .0 | .0 | .0 | .0 | .0 | .0 | .0 | .0 | .0 | .0 |
| Account Receivables | 4,467.1 | 5,579.4 | 4,639.8 | 3,368.5 | 2,149.1 | 3,882.5 | 4,223.0 | 4,593.4 | 4,996.2 | 5,434.4 |
| Account Receivables, % | 9.18 | 8.89 | 8.98 | 7.03 | 4.67 | 7.75 | 7.75 | 7.75 | 7.75 | 7.75 |
| Inventories | 3,788.1 | 3,171.4 | 2,944.0 | 3,218.1 | 3,203.3 | 3,227.2 | 3,510.2 | 3,818.1 | 4,152.9 | 4,517.1 |
| Inventories, % | 7.79 | 5.05 | 5.7 | 6.71 | 6.95 | 6.44 | 6.44 | 6.44 | 6.44 | 6.44 |
| Accounts Payable | 12,239.8 | 9,752.6 | 8,526.9 | 9,785.7 | 9,117.4 | 9,761.1 | 10,617.2 | 11,548.3 | 12,561.1 | 13,662.6 |
| Accounts Payable, % | 25.17 | 15.54 | 16.51 | 20.41 | 19.8 | 19.48 | 19.48 | 19.48 | 19.48 | 19.48 |
| Capital Expenditure | -2,589.1 | -2,278.2 | -2,680.3 | -3,827.6 | -3,026.1 | -2,875.3 | -3,127.4 | -3,401.7 | -3,700.0 | -4,024.5 |
| Capital Expenditure, % | -5.32 | -3.63 | -5.19 | -7.98 | -6.57 | -5.74 | -5.74 | -5.74 | -5.74 | -5.74 |
| Tax Rate, % | 20.57 | 20.57 | 20.57 | 20.57 | 20.57 | 20.57 | 20.57 | 20.57 | 20.57 | 20.57 |
| EBITAT | 2,769.4 | 4,227.5 | 364.8 | .4 | -397.3 | 1,264.4 | 1,375.3 | 1,495.9 | 1,627.1 | 1,769.8 |
| Depreciation | ||||||||||
| Changes in Account Receivables | ||||||||||
| Changes in Inventories | ||||||||||
| Changes in Accounts Payable | ||||||||||
| Capital Expenditure | ||||||||||
| UFCF | 5,342.5 | 176.5 | -1,165.5 | -194.6 | -1,257.4 | -1,418.5 | -99.1 | -107.8 | -117.2 | -127.5 |
| WACC, % | 3.8 | 3.82 | 3.96 | 3.82 | 3.9 | 3.86 | 3.86 | 3.86 | 3.86 | 3.86 |
| PV UFCF | ||||||||||
| SUM PV UFCF | -1,760.1 | |||||||||
| Long Term Growth Rate, % | 2.00 | |||||||||
| Free cash flow (T + 1) | -130 | |||||||||
| Terminal Value | -6,996 | |||||||||
| Present Terminal Value | -5,789 | |||||||||
| Enterprise Value | -7,549 | |||||||||
| Net Debt | 9,529 | |||||||||
| Equity Value | -17,078 | |||||||||
| Diluted Shares Outstanding, MM | 2,409 | |||||||||
| Equity Value Per Share | -7.09 |
What You Will Receive
- Genuine Sansteel MinGuang Data: Comprehensive financials – including revenue and EBIT – derived from actual and projected statistics.
- Complete Customization: Modify all essential parameters (yellow cells) such as WACC, growth %, and tax rates as needed.
- Instant Valuation Adjustments: Automatic recalculations to assess how changes affect the fair value of Sansteel MinGuang (002110SZ).
- Flexible Excel Template: Designed for quick modifications, scenario analysis, and in-depth forecasts.
- Efficient and Precise: Avoid the hassle of building models from the ground up while ensuring accuracy and adaptability.
Key Features
- Real-Time 002110SZ Data: Pre-loaded with Sansteel MinGuang's historical financial information and future projections.
- Comprehensive Customization Options: Modify factors like revenue growth, profit margins, WACC, tax rates, and capital expenditures.
- Interactive Valuation Model: Automatically adjusts Net Present Value (NPV) and intrinsic value based on your specified inputs.
- Scenario Analysis: Develop multiple forecasting scenarios to examine various valuation possibilities.
- User-Friendly Interface: Intuitive design catering to both experienced and novice users.
How It Operates
- Step 1: Download the Excel spreadsheet.
- Step 2: Review the pre-filled data for Sansteel MinGuang Co., Ltd. (002110SZ), including historical and projected figures.
- Step 3: Modify key assumptions (highlighted in yellow) according to your analysis.
- Step 4: Observe the automatic recalculations for Sansteel MinGuang's intrinsic value.
- Step 5: Utilize the results for your investment strategies or reporting needs.
Why Opt for This Calculator?
- Designed for Industry Experts: A sophisticated tool tailored for analysts, CFOs, and consultants.
- Accurate Financial Data: Sansteel MinGuang Co., Ltd.'s historical and projected financials preloaded for reliability.
- Versatile Scenario Analysis: Effortlessly test various forecasts and assumptions.
- Clear Results: Instantly computes intrinsic value, NPV, and essential metrics.
- User-Friendly: Comprehensive step-by-step guidance to assist you throughout the process.
Who Should Use This Product?
- Professional Investors: Develop comprehensive and accurate valuation models for assessing investments in Sansteel MinGuang Co., Ltd. (002110SZ).
- Corporate Finance Teams: Evaluate valuation scenarios to inform strategic decisions within the company.
- Consultants and Advisors: Offer clients precise valuation insights related to Sansteel MinGuang Co., Ltd. (002110SZ).
- Students and Educators: Utilize real-world data to practice and teach financial modeling techniques.
- Industry Enthusiasts: Gain insights into the market valuation of companies like Sansteel MinGuang Co., Ltd. (002110SZ).
Contents of the Template
- Pre-Filled Data: Features Sansteel MinGuang Co., Ltd.'s historical financial performance and projections.
- Discounted Cash Flow Model: A customizable DCF valuation model with automatic computations.
- Weighted Average Cost of Capital (WACC): A specific sheet for WACC calculations based on user-defined inputs.
- Key Financial Ratios: Assess Sansteel MinGuang's profitability, efficiency, and financial leverage.
- Customizable Inputs: Easily modify revenue growth rates, margins, and tax percentages.
- Intuitive Dashboard: Visual representations and tables summarizing essential valuation outcomes.
Disclaimer
All information, articles, and product details provided on this website are for general informational and educational purposes only. We do not claim any ownership over, nor do we intend to infringe upon, any trademarks, copyrights, logos, brand names, or other intellectual property mentioned or depicted on this site. Such intellectual property remains the property of its respective owners, and any references here are made solely for identification or informational purposes, without implying any affiliation, endorsement, or partnership.
We make no representations or warranties, express or implied, regarding the accuracy, completeness, or suitability of any content or products presented. Nothing on this website should be construed as legal, tax, investment, financial, medical, or other professional advice. In addition, no part of this site—including articles or product references—constitutes a solicitation, recommendation, endorsement, advertisement, or offer to buy or sell any securities, franchises, or other financial instruments, particularly in jurisdictions where such activity would be unlawful.
All content is of a general nature and may not address the specific circumstances of any individual or entity. It is not a substitute for professional advice or services. Any actions you take based on the information provided here are strictly at your own risk. You accept full responsibility for any decisions or outcomes arising from your use of this website and agree to release us from any liability in connection with your use of, or reliance upon, the content or products found herein.