
|
Shenzhen Clou Electronics Co., Ltd. (002121.SZ) Valation DCF |
Entièrement Modifiable: Adapté À Vos Besoins Dans Excel Ou Sheets
Conception Professionnelle: Modèles Fiables Et Conformes Aux Normes Du Secteur
Pré-Construits Pour Une Utilisation Rapide Et Efficace
Compatible MAC/PC, entièrement débloqué
Aucune Expertise N'Est Requise; Facile À Suivre
Shenzhen Clou Electronics Co., Ltd. (002121.SZ) Bundle
Rationalisez votre analyse et améliorez la précision avec notre calculatrice DCF (002121SZ)! Avec des données à jour de Shenzhen Clou Electronics Co., Ltd. et des hypothèses personnalisables, cet outil vous permet de prévoir, analyser et valoriser (002121SZ) comme un investisseur chevronné.
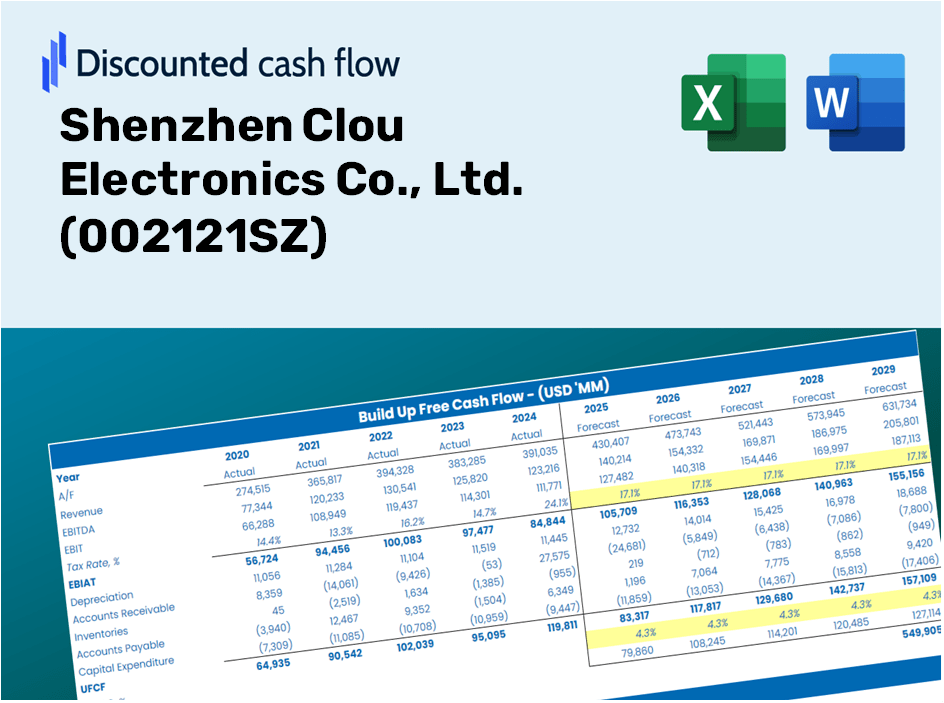
Discounted Cash Flow (DCF) - (USD MM)
| Year | AY1 2020 |
AY2 2021 |
AY3 2022 |
AY4 2023 |
AY5 2024 |
FY1 2025 |
FY2 2026 |
FY3 2027 |
FY4 2028 |
FY5 2029 |
|---|---|---|---|---|---|---|---|---|---|---|
| Revenue | 3,337.3 | 3,198.2 | 3,538.8 | 4,200.0 | 4,431.0 | 5,005.3 | 5,654.0 | 6,386.8 | 7,214.6 | 8,149.7 |
| Revenue Growth, % | 0 | -4.17 | 10.65 | 18.68 | 5.5 | 12.96 | 12.96 | 12.96 | 12.96 | 12.96 |
| EBITDA | -93.9 | 36.4 | 96.5 | 122.6 | 249.6 | 96.1 | 108.6 | 122.7 | 138.6 | 156.5 |
| EBITDA, % | -2.81 | 1.14 | 2.73 | 2.92 | 5.63 | 1.92 | 1.92 | 1.92 | 1.92 | 1.92 |
| Depreciation | 226.8 | 189.8 | 140.5 | 142.5 | 150.7 | 235.2 | 265.7 | 300.1 | 339.0 | 383.0 |
| Depreciation, % | 6.8 | 5.94 | 3.97 | 3.39 | 3.4 | 4.7 | 4.7 | 4.7 | 4.7 | 4.7 |
| EBIT | -320.7 | -153.5 | -43.9 | -20.0 | 99.0 | -139.1 | -157.1 | -177.5 | -200.5 | -226.4 |
| EBIT, % | -9.61 | -4.8 | -1.24 | -0.47578 | 2.23 | -2.78 | -2.78 | -2.78 | -2.78 | -2.78 |
| Total Cash | 1,065.8 | 761.5 | 1,117.9 | 903.2 | 1,311.4 | 1,385.9 | 1,565.5 | 1,768.4 | 1,997.6 | 2,256.5 |
| Total Cash, percent | .0 | .0 | .0 | .0 | .0 | .0 | .0 | .0 | .0 | .0 |
| Account Receivables | 2,414.6 | 1,522.6 | 1,464.1 | 1,298.0 | 1,337.7 | 2,226.6 | 2,515.2 | 2,841.2 | 3,209.5 | 3,625.5 |
| Account Receivables, % | 72.35 | 47.61 | 41.37 | 30.91 | 30.19 | 44.49 | 44.49 | 44.49 | 44.49 | 44.49 |
| Inventories | 882.1 | 719.2 | 1,158.8 | 880.1 | 878.2 | 1,225.7 | 1,384.5 | 1,564.0 | 1,766.7 | 1,995.7 |
| Inventories, % | 26.43 | 22.49 | 32.74 | 20.95 | 19.82 | 24.49 | 24.49 | 24.49 | 24.49 | 24.49 |
| Accounts Payable | 2,148.3 | 2,193.6 | 2,037.2 | 1,857.9 | 1,124.7 | 2,604.2 | 2,941.8 | 3,323.0 | 3,753.7 | 4,240.2 |
| Accounts Payable, % | 64.37 | 68.59 | 57.57 | 44.24 | 25.38 | 52.03 | 52.03 | 52.03 | 52.03 | 52.03 |
| Capital Expenditure | -294.3 | -440.7 | -376.5 | -457.4 | -282.8 | -505.7 | -571.2 | -645.2 | -728.9 | -823.3 |
| Capital Expenditure, % | -8.82 | -13.78 | -10.64 | -10.89 | -6.38 | -10.1 | -10.1 | -10.1 | -10.1 | -10.1 |
| Tax Rate, % | -1.8 | -1.8 | -1.8 | -1.8 | -1.8 | -1.8 | -1.8 | -1.8 | -1.8 | -1.8 |
| EBITAT | -257.2 | -155.0 | -25.5 | -17.7 | 100.8 | -118.7 | -134.1 | -151.5 | -171.1 | -193.3 |
| Depreciation | ||||||||||
| Changes in Account Receivables | ||||||||||
| Changes in Inventories | ||||||||||
| Changes in Accounts Payable | ||||||||||
| Capital Expenditure | ||||||||||
| UFCF | -1,473.0 | 694.1 | -798.9 | -67.1 | -802.5 | -146.0 | -549.5 | -620.8 | -701.2 | -792.1 |
| WACC, % | 6.03 | 6.19 | 5.84 | 6.1 | 6.19 | 6.07 | 6.07 | 6.07 | 6.07 | 6.07 |
| PV UFCF | ||||||||||
| SUM PV UFCF | -2,290.1 | |||||||||
| Long Term Growth Rate, % | 3.00 | |||||||||
| Free cash flow (T + 1) | -816 | |||||||||
| Terminal Value | -26,567 | |||||||||
| Present Terminal Value | -19,786 | |||||||||
| Enterprise Value | -22,076 | |||||||||
| Net Debt | 1,605 | |||||||||
| Equity Value | -23,682 | |||||||||
| Diluted Shares Outstanding, MM | 1,661 | |||||||||
| Equity Value Per Share | -14.26 |
Benefits You Will Receive
- Authentic 002121SZ Financial Data: Comes pre-loaded with Shenzhen Clou Electronics' historical and forecasted data for accurate analysis.
- Completely Customizable Template: Easily adjust key parameters such as revenue growth, WACC, and EBITDA %.
- Instant Calculations: Witness the immediate update of Shenzhen Clou Electronics' intrinsic value as you make modifications.
- Expert Valuation Tool: Crafted for investors, analysts, and consultants in pursuit of precise DCF outcomes.
- Intuitive Design: Clear layout and straightforward instructions suitable for users of all proficiency levels.
Core Benefits
- Authentic Shenzhen Clou Financials: Gain access to reliable pre-loaded historical data and future forecasts.
- Adjustable Forecast Parameters: Modify the yellow-highlighted cells such as WACC, growth rates, and profit margins.
- Automated Calculations: Real-time updates for DCF, Net Present Value (NPV), and cash flow assessments.
- Interactive Dashboard: User-friendly charts and summaries for visualizing your valuation insights.
- Suitable for All Experience Levels: An intuitive layout tailored for investors, CFOs, and consultants alike.
How It Operates
- Download: Obtain the pre-built Excel file containing Shenzhen Clou Electronics Co., Ltd.'s financial data.
- Customize: Modify forecasts, such as revenue growth, EBITDA %, and WACC.
- Update Automatically: The intrinsic value and NPV calculations refresh in real-time.
- Test Scenarios: Generate multiple projections and instantly compare the results.
- Make Decisions: Leverage the valuation outcomes to inform your investment strategy for (002121SZ).
Why Choose This Calculator for Shenzhen Clou Electronics Co., Ltd. (002121SZ)?
- Reliable Data: Up-to-date Shenzhen Clou financials guarantee trustworthy valuation outcomes.
- Flexible: Modify essential variables such as growth rates, WACC, and tax rates to align with your forecasts.
- Efficiency: Built-in calculations save you from starting from ground zero.
- Industry-Standard Tool: Ideal for investors, analysts, and consultants working with Shenzhen Clou.
- Easy to Use: A straightforward design and clear instructions ensure accessibility for all users.
Who Can Benefit from Our Services?
- Electronics Students: Master circuit design principles and apply them using real-world examples.
- Researchers: Utilize advanced models in your studies or projects related to electronics.
- Investors: Validate your investment hypotheses and evaluate market performance for Shenzhen Clou Electronics Co., Ltd. (002121SZ).
- Market Analysts: Enhance your analysis with our user-friendly, customizable financial models.
- Entrepreneurs: Discover the analytical methods used to assess large electronic firms like Shenzhen Clou Electronics Co., Ltd. (002121SZ).
Overview of the Template's Contents
- Preloaded SZ Clou Data: Historical and forecasted financial metrics, encompassing revenue, EBIT, and capital expenditures.
- DCF and WACC Models: Advanced spreadsheets designed to determine intrinsic value and Weighted Average Cost of Capital.
- Customizable Inputs: Cells highlighted in yellow for modifying revenue growth, tax rates, and discount rates.
- Financial Statements: Detailed annual and quarterly financial reports for comprehensive analysis.
- Key Ratios: Metrics for profitability, leverage, and efficiency to assess operational performance.
- Dashboard and Charts: Visual representations of valuation results and underlying assumptions.
Disclaimer
All information, articles, and product details provided on this website are for general informational and educational purposes only. We do not claim any ownership over, nor do we intend to infringe upon, any trademarks, copyrights, logos, brand names, or other intellectual property mentioned or depicted on this site. Such intellectual property remains the property of its respective owners, and any references here are made solely for identification or informational purposes, without implying any affiliation, endorsement, or partnership.
We make no representations or warranties, express or implied, regarding the accuracy, completeness, or suitability of any content or products presented. Nothing on this website should be construed as legal, tax, investment, financial, medical, or other professional advice. In addition, no part of this site—including articles or product references—constitutes a solicitation, recommendation, endorsement, advertisement, or offer to buy or sell any securities, franchises, or other financial instruments, particularly in jurisdictions where such activity would be unlawful.
All content is of a general nature and may not address the specific circumstances of any individual or entity. It is not a substitute for professional advice or services. Any actions you take based on the information provided here are strictly at your own risk. You accept full responsibility for any decisions or outcomes arising from your use of this website and agree to release us from any liability in connection with your use of, or reliance upon, the content or products found herein.