
|
Tech-Bank Food Co., Ltd. (002124.SZ) Évaluation DCF |
Entièrement Modifiable: Adapté À Vos Besoins Dans Excel Ou Sheets
Conception Professionnelle: Modèles Fiables Et Conformes Aux Normes Du Secteur
Pré-Construits Pour Une Utilisation Rapide Et Efficace
Compatible MAC/PC, entièrement débloqué
Aucune Expertise N'Est Requise; Facile À Suivre
Tech-Bank Food Co., Ltd. (002124.SZ) Bundle
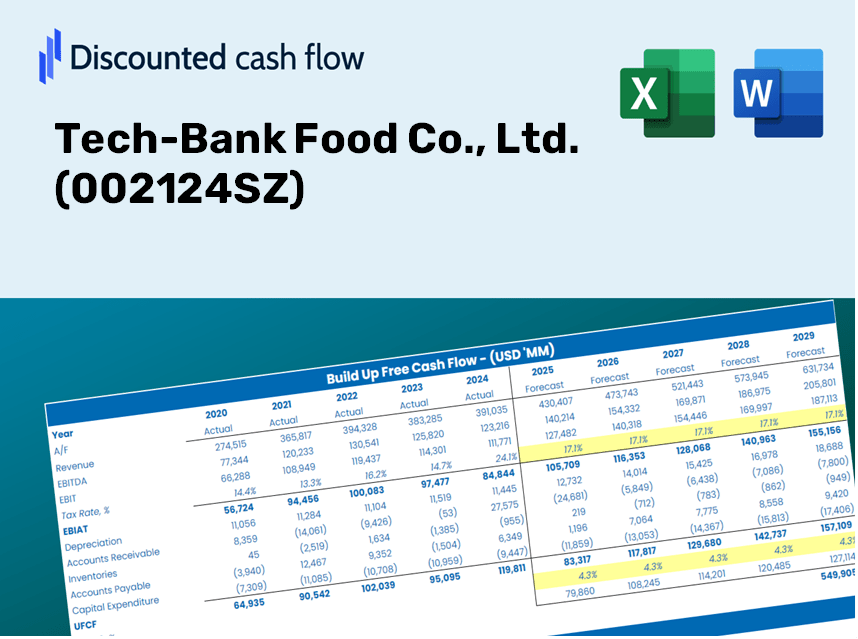
Explorez l'avenir financier de Tech-Bank Food Co., Ltd. (002124SZ) avec notre calculatrice DCF conviviale! Entrez vos projections pour la croissance, les marges et les dépenses pour calculer la valeur intrinsèque de Tech-Bank Food Co., Ltd. (002124SZ) et affinez votre stratégie d'investissement.
What You Will Receive
- Authentic 002124SZ Financials: Provides both historical data and future projections for precise valuation.
- Flexible Inputs: Adjust WACC, tax rates, revenue growth, and capital expenditure settings as needed.
- Automated Calculations: Calculates intrinsic value and NPV in real-time.
- Scenario Analysis: Explore various scenarios to assess Tech-Bank Food Co., Ltd.’s potential performance.
- User-Friendly Design: Designed for industry experts while remaining easy to use for newcomers.
Key Features
- Comprehensive DCF Calculator: Features in-depth unlevered and levered DCF valuation models tailored for Tech-Bank Food Co., Ltd. (002124SZ).
- WACC Calculator: Ready-to-use Weighted Average Cost of Capital spreadsheet with adjustable inputs.
- Customizable Forecast Assumptions: Adjust growth rates, capital expenditures, and discount rates as needed.
- Integrated Financial Ratios: Evaluate profitability, leverage, and efficiency ratios specifically for Tech-Bank Food Co., Ltd. (002124SZ).
- Interactive Dashboard and Charts: Visual representations present key valuation metrics for straightforward analysis.
How It Works
- Download the Template: Gain immediate access to the Excel-based Tech-Bank Food Co., Ltd. DCF Calculator.
- Input Your Assumptions: Modify the yellow-highlighted cells for growth rates, WACC, margins, and other key variables.
- Instant Calculations: The model will automatically compute Tech-Bank Food Co., Ltd.'s intrinsic value.
- Test Scenarios: Experiment with various assumptions to see how they impact the valuation.
- Analyze and Decide: Utilize the results to inform your investment or financial analysis.
Why Choose This Calculator for Tech-Bank Food Co., Ltd. (002124SZ)?
- User-Friendly Interface: Perfectly crafted for both novices and seasoned users.
- Customizable Inputs: Effortlessly adjust parameters to suit your financial evaluation.
- Real-Time Valuation: Instantly observe changes in Tech-Bank’s valuation as you modify the inputs.
- Preloaded Data: Comes with Tech-Bank’s actual financial information for immediate analysis.
- Professionally Endorsed: A reliable tool for investors and analysts aiming for well-informed choices.
Who Can Benefit from Tech-Bank Food Co., Ltd. (002124SZ)?
- Investors: Gain the tools needed to make informed investment decisions with our advanced valuation solutions.
- Financial Analysts: Streamline your workflow with our customizable DCF model designed for efficiency.
- Consultants: Effortlessly tailor our templates for impactful client presentations and comprehensive reports.
- Finance Enthusiasts: Enhance your knowledge of valuation methods through practical, real-life case studies.
- Educators and Students: Leverage our resources as effective learning tools in finance and business curricula.
Contents of the Template
- Preloaded Tech-Bank Food Co. Data: Historical and projected financial information, including revenue, EBIT, and capital expenditures.
- DCF and WACC Models: Professional-grade worksheets designed for calculating intrinsic value and Weighted Average Cost of Capital.
- Editable Inputs: Yellow-highlighted cells for modifying revenue growth, tax rates, and discount rates.
- Financial Statements: Comprehensive annual and quarterly financial reports for in-depth analysis.
- Key Ratios: Profitability, leverage, and efficiency ratios for performance assessment.
- Dashboard and Charts: Visual representations of valuation results and underlying assumptions.
Disclaimer
All information, articles, and product details provided on this website are for general informational and educational purposes only. We do not claim any ownership over, nor do we intend to infringe upon, any trademarks, copyrights, logos, brand names, or other intellectual property mentioned or depicted on this site. Such intellectual property remains the property of its respective owners, and any references here are made solely for identification or informational purposes, without implying any affiliation, endorsement, or partnership.
We make no representations or warranties, express or implied, regarding the accuracy, completeness, or suitability of any content or products presented. Nothing on this website should be construed as legal, tax, investment, financial, medical, or other professional advice. In addition, no part of this site—including articles or product references—constitutes a solicitation, recommendation, endorsement, advertisement, or offer to buy or sell any securities, franchises, or other financial instruments, particularly in jurisdictions where such activity would be unlawful.
All content is of a general nature and may not address the specific circumstances of any individual or entity. It is not a substitute for professional advice or services. Any actions you take based on the information provided here are strictly at your own risk. You accept full responsibility for any decisions or outcomes arising from your use of this website and agree to release us from any liability in connection with your use of, or reliance upon, the content or products found herein.