
|
Zhejiang Yinlun Machinery Co., Ltd. (002126.sz) Évaluation DCF |
Entièrement Modifiable: Adapté À Vos Besoins Dans Excel Ou Sheets
Conception Professionnelle: Modèles Fiables Et Conformes Aux Normes Du Secteur
Pré-Construits Pour Une Utilisation Rapide Et Efficace
Compatible MAC/PC, entièrement débloqué
Aucune Expertise N'Est Requise; Facile À Suivre
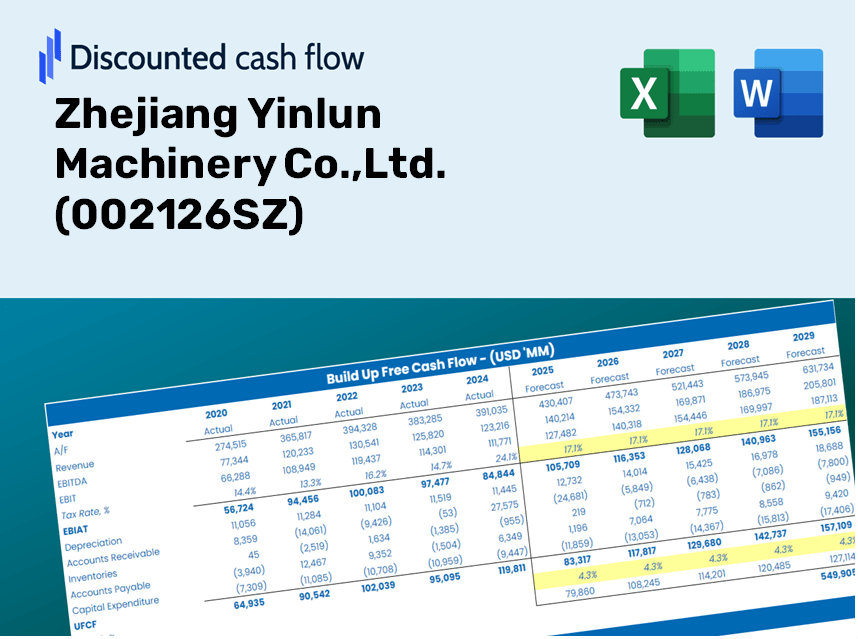
Zhejiang Yinlun Machinery Co.,Ltd. (002126.SZ) Bundle
Optimisez votre temps et améliorez la précision avec notre calculatrice DCF (002126SZ)! En utilisant de vraies données de Zhejiang Yinlun Machinery Co., Ltd. et des hypothèses personnalisables, cet outil vous permet de prévoir, analyser et évaluer (Zhejiang Yinlun Machinery Co., Ltd.) comme un investisseur assaisonné.
Discounted Cash Flow (DCF) - (USD MM)
| Year | AY1 2020 |
AY2 2021 |
AY3 2022 |
AY4 2023 |
AY5 2024 |
FY1 2025 |
FY2 2026 |
FY3 2027 |
FY4 2028 |
FY5 2029 |
|---|---|---|---|---|---|---|---|---|---|---|
| Revenue | 6,324.2 | 7,816.4 | 8,479.6 | 11,018.0 | 12,702.1 | 15,156.7 | 18,085.8 | 21,580.9 | 25,751.4 | 30,727.8 |
| Revenue Growth, % | 0 | 23.6 | 8.48 | 29.93 | 15.28 | 19.33 | 19.33 | 19.33 | 19.33 | 19.33 |
| EBITDA | 778.3 | 714.0 | 1,005.1 | 1,439.1 | 1,739.7 | 1,820.4 | 2,172.1 | 2,591.9 | 3,092.8 | 3,690.5 |
| EBITDA, % | 12.31 | 9.13 | 11.85 | 13.06 | 13.7 | 12.01 | 12.01 | 12.01 | 12.01 | 12.01 |
| Depreciation | 287.8 | 355.1 | 401.9 | 527.3 | 633.3 | 715.6 | 853.9 | 1,018.9 | 1,215.8 | 1,450.7 |
| Depreciation, % | 4.55 | 4.54 | 4.74 | 4.79 | 4.99 | 4.72 | 4.72 | 4.72 | 4.72 | 4.72 |
| EBIT | 490.4 | 358.9 | 603.2 | 911.8 | 1,106.4 | 1,104.8 | 1,318.3 | 1,573.0 | 1,877.0 | 2,239.8 |
| EBIT, % | 7.75 | 4.59 | 7.11 | 8.28 | 8.71 | 7.29 | 7.29 | 7.29 | 7.29 | 7.29 |
| Total Cash | 1,125.7 | 1,668.1 | 1,501.6 | 2,128.3 | 2,595.3 | 2,928.2 | 3,494.1 | 4,169.3 | 4,975.0 | 5,936.5 |
| Total Cash, percent | .0 | .0 | .0 | .0 | .0 | .0 | .0 | .0 | .0 | .0 |
| Account Receivables | 3,664.8 | 3,878.3 | 4,529.3 | 5,507.8 | 6,388.0 | 7,919.7 | 9,450.2 | 11,276.4 | 13,455.6 | 16,055.9 |
| Account Receivables, % | 57.95 | 49.62 | 53.41 | 49.99 | 50.29 | 52.25 | 52.25 | 52.25 | 52.25 | 52.25 |
| Inventories | 1,045.2 | 1,481.4 | 1,862.7 | 2,062.6 | 2,273.1 | 2,851.3 | 3,402.4 | 4,059.9 | 4,844.4 | 5,780.6 |
| Inventories, % | 16.53 | 18.95 | 21.97 | 18.72 | 17.9 | 18.81 | 18.81 | 18.81 | 18.81 | 18.81 |
| Accounts Payable | 3,229.5 | 3,643.7 | 4,700.7 | 5,671.3 | 6,686.2 | 7,797.5 | 9,304.3 | 11,102.4 | 13,248.0 | 15,808.1 |
| Accounts Payable, % | 51.07 | 46.62 | 55.43 | 51.47 | 52.64 | 51.45 | 51.45 | 51.45 | 51.45 | 51.45 |
| Capital Expenditure | -426.2 | -784.8 | -1,124.0 | -1,013.2 | -823.9 | -1,385.8 | -1,653.6 | -1,973.2 | -2,354.5 | -2,809.5 |
| Capital Expenditure, % | -6.74 | -10.04 | -13.26 | -9.2 | -6.49 | -9.14 | -9.14 | -9.14 | -9.14 | -9.14 |
| Tax Rate, % | 21.83 | 21.83 | 21.83 | 21.83 | 21.83 | 21.83 | 21.83 | 21.83 | 21.83 | 21.83 |
| EBITAT | 376.6 | 278.2 | 478.2 | 707.9 | 864.9 | 860.4 | 1,026.7 | 1,225.1 | 1,461.8 | 1,744.3 |
| Depreciation | ||||||||||
| Changes in Account Receivables | ||||||||||
| Changes in Inventories | ||||||||||
| Changes in Accounts Payable | ||||||||||
| Capital Expenditure | ||||||||||
| UFCF | -1,242.3 | -386.9 | -219.1 | 14.3 | 598.4 | -808.5 | -347.7 | -414.9 | -495.1 | -590.8 |
| WACC, % | 6.38 | 6.38 | 6.38 | 6.38 | 6.38 | 6.38 | 6.38 | 6.38 | 6.38 | 6.38 |
| PV UFCF | ||||||||||
| SUM PV UFCF | -2,232.1 | |||||||||
| Long Term Growth Rate, % | 4.00 | |||||||||
| Free cash flow (T + 1) | -614 | |||||||||
| Terminal Value | -25,812 | |||||||||
| Present Terminal Value | -18,946 | |||||||||
| Enterprise Value | -21,178 | |||||||||
| Net Debt | 695 | |||||||||
| Equity Value | -21,873 | |||||||||
| Diluted Shares Outstanding, MM | 852 | |||||||||
| Equity Value Per Share | -25.68 |
What You Will Receive
- Genuine Zhejiang Yinlun Data: Preloaded financial information – ranging from revenue to EBIT – based on historical and forecasted figures.
- Comprehensive Customization: Modify all essential parameters (yellow cells) such as WACC, growth %, and tax rates.
- Immediate Valuation Updates: Automatic recalculations to assess the effects of changes on Zhejiang Yinlun’s fair value.
- Flexible Excel Template: Designed for quick adjustments, scenario analysis, and in-depth projections.
- Efficient and Reliable: Avoid the hassle of building models from scratch while ensuring accuracy and adaptability.
Key Features
- Comprehensive DCF Calculator: Features detailed unlevered and levered DCF valuation models tailored for Zhejiang Yinlun Machinery Co.,Ltd. (002126SZ).
- WACC Calculation Tool: Comes with a pre-built Weighted Average Cost of Capital sheet, allowing for customizable input parameters.
- Customizable Forecast Assumptions: Easily adjust growth rates, capital expenditures, and discount rates as needed.
- Integrated Financial Ratios: Assess profitability, leverage, and efficiency ratios specific to Zhejiang Yinlun Machinery Co.,Ltd. (002126SZ).
- Interactive Dashboard and Charts: Visual representations of key valuation metrics facilitate straightforward analysis.
How It Works
- Step 1: Download the Excel file for Zhejiang Yinlun Machinery Co., Ltd. (002126SZ).
- Step 2: Examine the pre-filled financial data and forecasts for Zhejiang Yinlun.
- Step 3: Adjust key variables such as revenue growth, WACC, and tax rates (highlighted cells).
- Step 4: Observe the DCF model update in real-time as you refine your assumptions.
- Step 5: Evaluate the outputs and leverage the results for informed investment choices.
Why Choose Zhejiang Yinlun Machinery Co., Ltd. (002126SZ)?
- Time-Efficient: No need to start from scratch – our solutions are ready for immediate use.
- Enhanced Precision: Dependable data and established methodologies minimize valuation errors.
- Completely Customizable: Adjust the model to align with your specific assumptions and forecasts.
- Easy to Understand: Intuitive charts and outputs simplify the analysis of results.
- Expert Recommended: Crafted for professionals who prioritize accuracy and functionality.
Who Can Benefit from This Product?
- Investors: Evaluate the valuation of Zhejiang Yinlun Machinery Co., Ltd. (002126SZ) before making investment decisions.
- CFOs and Financial Analysts: Optimize valuation methodologies and assess financial projections for better insights.
- Startup Founders: Understand how established companies like Zhejiang Yinlun Machinery Co., Ltd. (002126SZ) are valued in the marketplace.
- Consultants: Provide detailed and professional valuation reports for your clients' needs.
- Students and Educators: Utilize real-world examples to practice and teach effective valuation strategies.
Contents of the Template
- Operating and Balance Sheet Data: Pre-filled historical data and forecasts for Zhejiang Yinlun Machinery Co., Ltd. (002126SZ), including revenue, EBITDA, EBIT, and capital expenditures.
- WACC Calculation: A dedicated sheet for the Weighted Average Cost of Capital (WACC), featuring parameters such as Beta, risk-free rate, and share price.
- DCF Valuation (Unlevered and Levered): Customizable Discounted Cash Flow models that reveal intrinsic value along with comprehensive calculations.
- Financial Statements: Pre-loaded annual and quarterly financial statements to aid in analysis.
- Key Ratios: A collection of profitability, leverage, and efficiency ratios relevant to Zhejiang Yinlun Machinery Co., Ltd. (002126SZ).
- Dashboard and Charts: Visual overview of valuation outcomes and assumptions for easy result analysis.
Disclaimer
All information, articles, and product details provided on this website are for general informational and educational purposes only. We do not claim any ownership over, nor do we intend to infringe upon, any trademarks, copyrights, logos, brand names, or other intellectual property mentioned or depicted on this site. Such intellectual property remains the property of its respective owners, and any references here are made solely for identification or informational purposes, without implying any affiliation, endorsement, or partnership.
We make no representations or warranties, express or implied, regarding the accuracy, completeness, or suitability of any content or products presented. Nothing on this website should be construed as legal, tax, investment, financial, medical, or other professional advice. In addition, no part of this site—including articles or product references—constitutes a solicitation, recommendation, endorsement, advertisement, or offer to buy or sell any securities, franchises, or other financial instruments, particularly in jurisdictions where such activity would be unlawful.
All content is of a general nature and may not address the specific circumstances of any individual or entity. It is not a substitute for professional advice or services. Any actions you take based on the information provided here are strictly at your own risk. You accept full responsibility for any decisions or outcomes arising from your use of this website and agree to release us from any liability in connection with your use of, or reliance upon, the content or products found herein.