
|
Shenzhen Woer Heat-Shrinkable Material Co., Ltd. (002130.SZ) Évaluation DCF |
Entièrement Modifiable: Adapté À Vos Besoins Dans Excel Ou Sheets
Conception Professionnelle: Modèles Fiables Et Conformes Aux Normes Du Secteur
Pré-Construits Pour Une Utilisation Rapide Et Efficace
Compatible MAC/PC, entièrement débloqué
Aucune Expertise N'Est Requise; Facile À Suivre
ShenZhen Woer Heat-Shrinkable Material Co.,Ltd. (002130.SZ) Bundle
Simplifier Shenzhen Woer Heat-Shrinkable Material Co., Ltd. Évaluation avec cette calculatrice DCF personnalisable! Avec Real Shenzhen Woer Heat-Shrinkable Material Co., Ltd. Entrées financières et prévisions réglables, vous pouvez tester des scénarios et découvrir Shenzhen Woer Heat-Shrinkable Material Co., Ltd. juste valeur en minutes.
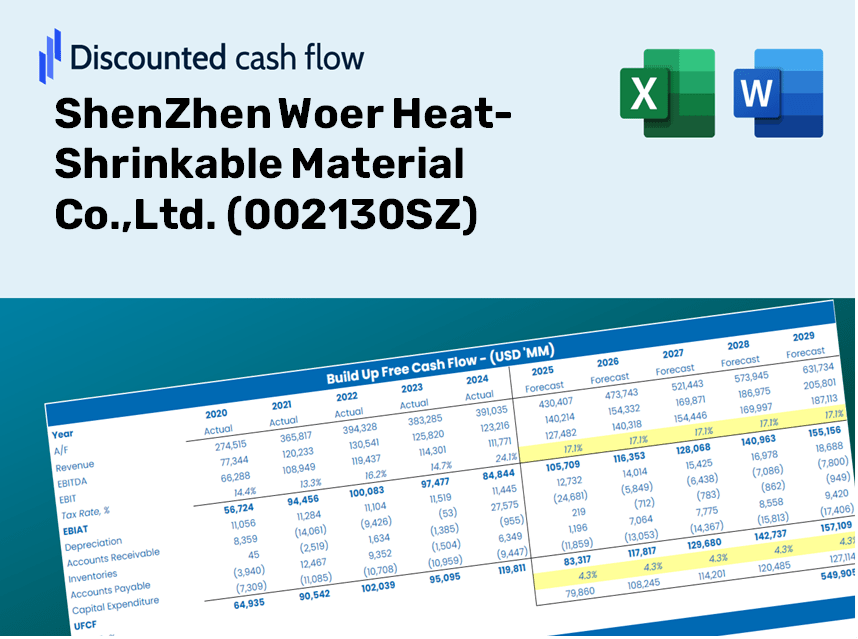
Discounted Cash Flow (DCF) - (USD MM)
| Year | AY1 2020 |
AY2 2021 |
AY3 2022 |
AY4 2023 |
AY5 2024 |
FY1 2025 |
FY2 2026 |
FY3 2027 |
FY4 2028 |
FY5 2029 |
|---|---|---|---|---|---|---|---|---|---|---|
| Revenue | 4,094.8 | 5,406.6 | 5,340.9 | 5,723.2 | 6,926.5 | 7,948.3 | 9,120.7 | 10,466.1 | 12,010.0 | 13,781.6 |
| Revenue Growth, % | 0 | 32.04 | -1.22 | 7.16 | 21.03 | 14.75 | 14.75 | 14.75 | 14.75 | 14.75 |
| EBITDA | 814.6 | 943.2 | 934.5 | 1,106.0 | 1,341.2 | 1,486.7 | 1,706.0 | 1,957.7 | 2,246.5 | 2,577.9 |
| EBITDA, % | 19.89 | 17.45 | 17.5 | 19.33 | 19.36 | 18.7 | 18.7 | 18.7 | 18.7 | 18.7 |
| Depreciation | 213.5 | 204.6 | 206.8 | 203.9 | 220.7 | 311.9 | 357.9 | 410.7 | 471.3 | 540.8 |
| Depreciation, % | 5.21 | 3.79 | 3.87 | 3.56 | 3.19 | 3.92 | 3.92 | 3.92 | 3.92 | 3.92 |
| EBIT | 601.1 | 738.5 | 727.6 | 902.1 | 1,120.5 | 1,174.8 | 1,348.1 | 1,547.0 | 1,775.2 | 2,037.0 |
| EBIT, % | 14.68 | 13.66 | 13.62 | 15.76 | 16.18 | 14.78 | 14.78 | 14.78 | 14.78 | 14.78 |
| Total Cash | 639.1 | 738.1 | 864.6 | 1,065.6 | 1,173.4 | 1,287.7 | 1,477.7 | 1,695.7 | 1,945.8 | 2,232.8 |
| Total Cash, percent | .0 | .0 | .0 | .0 | .0 | .0 | .0 | .0 | .0 | .0 |
| Account Receivables | 1,801.9 | 2,306.1 | 2,381.5 | 2,761.6 | 3,289.7 | 3,608.4 | 4,140.7 | 4,751.5 | 5,452.4 | 6,256.7 |
| Account Receivables, % | 44 | 42.65 | 44.59 | 48.25 | 47.49 | 45.4 | 45.4 | 45.4 | 45.4 | 45.4 |
| Inventories | 478.7 | 596.3 | 701.3 | 710.3 | 865.3 | 965.8 | 1,108.2 | 1,271.7 | 1,459.3 | 1,674.6 |
| Inventories, % | 11.69 | 11.03 | 13.13 | 12.41 | 12.49 | 12.15 | 12.15 | 12.15 | 12.15 | 12.15 |
| Accounts Payable | 707.4 | 790.4 | 982.4 | 1,191.6 | 1,513.0 | 1,477.6 | 1,695.6 | 1,945.7 | 2,232.7 | 2,562.1 |
| Accounts Payable, % | 17.27 | 14.62 | 18.39 | 20.82 | 21.84 | 18.59 | 18.59 | 18.59 | 18.59 | 18.59 |
| Capital Expenditure | -300.0 | -318.1 | -369.9 | -250.4 | -445.4 | -491.9 | -564.4 | -647.7 | -743.2 | -852.9 |
| Capital Expenditure, % | -7.33 | -5.88 | -6.93 | -4.38 | -6.43 | -6.19 | -6.19 | -6.19 | -6.19 | -6.19 |
| Tax Rate, % | 21.07 | 21.07 | 21.07 | 21.07 | 21.07 | 21.07 | 21.07 | 21.07 | 21.07 | 21.07 |
| EBITAT | 481.1 | 622.1 | 614.9 | 723.9 | 884.3 | 958.5 | 1,099.9 | 1,262.2 | 1,448.3 | 1,662.0 |
| Depreciation | ||||||||||
| Changes in Account Receivables | ||||||||||
| Changes in Inventories | ||||||||||
| Changes in Accounts Payable | ||||||||||
| Capital Expenditure | ||||||||||
| UFCF | -1,178.6 | -30.2 | 463.6 | 497.4 | 298.0 | 324.0 | 436.6 | 501.0 | 574.9 | 659.8 |
| WACC, % | 6.08 | 6.09 | 6.09 | 6.08 | 6.08 | 6.09 | 6.09 | 6.09 | 6.09 | 6.09 |
| PV UFCF | ||||||||||
| SUM PV UFCF | 2,057.9 | |||||||||
| Long Term Growth Rate, % | 3.50 | |||||||||
| Free cash flow (T + 1) | 683 | |||||||||
| Terminal Value | 26,395 | |||||||||
| Present Terminal Value | 19,643 | |||||||||
| Enterprise Value | 21,701 | |||||||||
| Net Debt | 410 | |||||||||
| Equity Value | 21,290 | |||||||||
| Diluted Shares Outstanding, MM | 1,246 | |||||||||
| Equity Value Per Share | 17.08 |
What You Will Receive
- Authentic 002130SZ Financials: Access to both historical and projected data for precise valuation.
- Customizable Inputs: Adjust parameters such as WACC, tax rates, revenue growth, and capital expenditures.
- Automated Calculations: Dynamic computation of intrinsic value and NPV.
- Scenario Analysis: Explore various scenarios to assess the future outlook of ShenZhen Woer Heat-Shrinkable Material Co., Ltd.
- User-Friendly Design: Designed for industry professionals while remaining approachable for newcomers.
Key Features
- 🔍 Real-Life 002130SZ Financials: Pre-filled historical and projected data for ShenZhen Woer Heat-Shrinkable Material Co., Ltd.
- ✏️ Fully Customizable Inputs: Adjust all critical parameters (yellow cells) such as WACC, growth %, and tax rates to fit your analysis.
- 📊 Professional DCF Valuation: Integrated formulas compute ShenZhen Woer’s intrinsic value using the Discounted Cash Flow method.
- ⚡ Instant Results: See ShenZhen Woer’s valuation updated in real-time as you modify inputs.
- Scenario Analysis: Evaluate and compare the impact of different financial assumptions side-by-side.
How It Functions
- Step 1: Download the ready-to-use Excel template containing data for ShenZhen Woer Heat-Shrinkable Material Co.,Ltd. (002130SZ).
- Step 2: Review the pre-filled sheets to familiarize yourself with the essential metrics.
- Step 3: Modify the forecasts and assumptions in the editable yellow cells (WACC, growth, margins).
- Step 4: Instantly access recalibrated results, including the intrinsic value of ShenZhen Woer (002130SZ).
- Step 5: Utilize the outputs to make informed investment choices or create detailed reports.
Why Select This Calculator?
- User-Friendly Interface: Crafted for both novices and seasoned professionals.
- Customizable Inputs: Modify parameters effortlessly to suit your analysis needs.
- Real-Time Updates: Observe immediate changes to ShenZhen Woer Heat-Shrinkable Material Co.,Ltd.'s valuation as you adjust the inputs.
- Preloaded Financial Data: Comes equipped with ShenZhen Woer’s actual financial metrics for rapid assessment.
- Endorsed by Experts: Utilized by investors and analysts for making well-informed decisions.
Who Can Benefit from Our Products?
- Manufacturers: Enhance production efficiency with our advanced heat-shrinkable materials.
- Engineers: Streamline your projects using our customizable solutions designed for various applications.
- Distributors: Easily adapt our materials for effective marketing and client use.
- Research and Development Teams: Gain insights into innovative material usage with our extensive product knowledge.
- Students and Educators: Utilize our materials as a hands-on learning resource in engineering and materials science courses.
Contents of the Template
- Pre-Filled DCF Model: ShenZhen Woer Heat-Shrinkable Material Co., Ltd.’s financial data ready for immediate analysis.
- WACC Calculator: Comprehensive calculations for Weighted Average Cost of Capital specific to [002130SZ].
- Financial Ratios: Assess the profitability, leverage, and efficiency of ShenZhen Woer Heat-Shrinkable Material Co., Ltd.
- Editable Inputs: Modify assumptions regarding growth, margins, and CAPEX to suit your analysis.
- Financial Statements: Access annual and quarterly reports for thorough evaluation.
- Interactive Dashboard: Effortlessly visualize essential valuation metrics and outcomes.
Disclaimer
All information, articles, and product details provided on this website are for general informational and educational purposes only. We do not claim any ownership over, nor do we intend to infringe upon, any trademarks, copyrights, logos, brand names, or other intellectual property mentioned or depicted on this site. Such intellectual property remains the property of its respective owners, and any references here are made solely for identification or informational purposes, without implying any affiliation, endorsement, or partnership.
We make no representations or warranties, express or implied, regarding the accuracy, completeness, or suitability of any content or products presented. Nothing on this website should be construed as legal, tax, investment, financial, medical, or other professional advice. In addition, no part of this site—including articles or product references—constitutes a solicitation, recommendation, endorsement, advertisement, or offer to buy or sell any securities, franchises, or other financial instruments, particularly in jurisdictions where such activity would be unlawful.
All content is of a general nature and may not address the specific circumstances of any individual or entity. It is not a substitute for professional advice or services. Any actions you take based on the information provided here are strictly at your own risk. You accept full responsibility for any decisions or outcomes arising from your use of this website and agree to release us from any liability in connection with your use of, or reliance upon, the content or products found herein.