
|
Beijing Bdstar Navigation Co., Ltd. (002151.SZ) Évaluation DCF |
Entièrement Modifiable: Adapté À Vos Besoins Dans Excel Ou Sheets
Conception Professionnelle: Modèles Fiables Et Conformes Aux Normes Du Secteur
Pré-Construits Pour Une Utilisation Rapide Et Efficace
Compatible MAC/PC, entièrement débloqué
Aucune Expertise N'Est Requise; Facile À Suivre
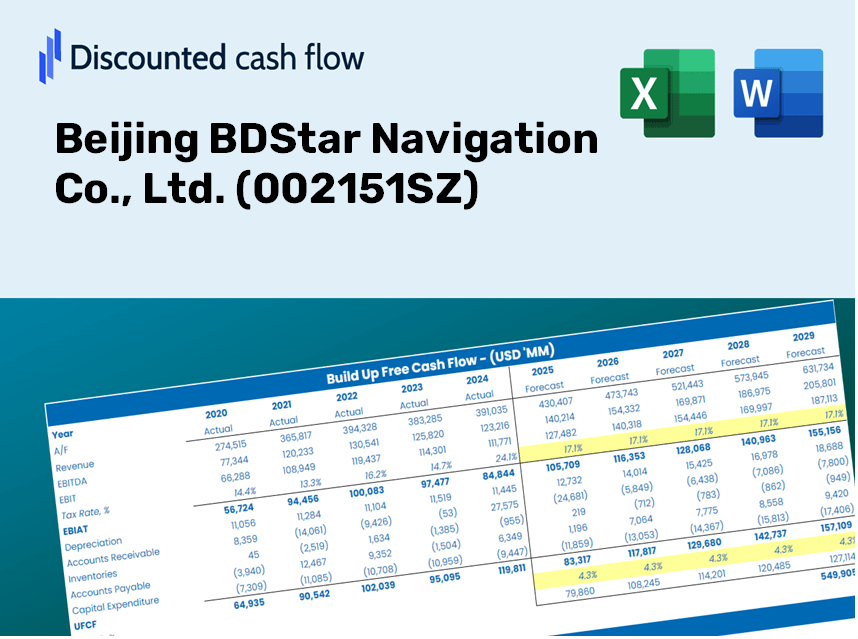
Beijing BDStar Navigation Co., Ltd. (002151.SZ) Bundle
Vous cherchez à déterminer la valeur intrinsèque de Beijing Bdstar Navigation Co., Ltd.? Notre calculatrice DCF (002151SZ) intègre des données réelles avec des fonctionnalités de personnalisation complètes, vous permettant d'affiner vos prévisions et d'améliorer vos choix d'investissement.
Discounted Cash Flow (DCF) - (USD MM)
| Year | AY1 2020 |
AY2 2021 |
AY3 2022 |
AY4 2023 |
AY5 2024 |
FY1 2025 |
FY2 2026 |
FY3 2027 |
FY4 2028 |
FY5 2029 |
|---|---|---|---|---|---|---|---|---|---|---|
| Revenue | 3,624.3 | 3,850.7 | 3,816.1 | 4,082.2 | 1,498.3 | 1,307.4 | 1,140.8 | 995.4 | 868.5 | 757.8 |
| Revenue Growth, % | 0 | 6.24 | -0.89826 | 6.97 | -63.3 | -12.74 | -12.74 | -12.74 | -12.74 | -12.74 |
| EBITDA | 346.8 | 349.1 | 247.0 | -184.2 | -207.2 | 17.7 | 15.4 | 13.5 | 11.8 | 10.3 |
| EBITDA, % | 9.57 | 9.07 | 6.47 | -4.51 | -13.83 | 1.35 | 1.35 | 1.35 | 1.35 | 1.35 |
| Depreciation | 216.5 | 240.1 | 263.0 | 303.7 | 213.4 | 106.6 | 93.0 | 81.2 | 70.8 | 61.8 |
| Depreciation, % | 5.97 | 6.24 | 6.89 | 7.44 | 14.24 | 8.16 | 8.16 | 8.16 | 8.16 | 8.16 |
| EBIT | 130.3 | 109.0 | -16.0 | -487.9 | -420.6 | -88.9 | -77.6 | -67.7 | -59.1 | -51.6 |
| EBIT, % | 3.6 | 2.83 | -0.41864 | -11.95 | -28.07 | -6.8 | -6.8 | -6.8 | -6.8 | -6.8 |
| Total Cash | 1,592.4 | 1,834.3 | 1,241.4 | 1,842.3 | 1,724.2 | 704.0 | 614.3 | 536.0 | 467.7 | 408.1 |
| Total Cash, percent | .0 | .0 | .0 | .0 | .0 | .0 | .0 | .0 | .0 | .0 |
| Account Receivables | 1,251.2 | 1,103.8 | 1,601.1 | 998.6 | 804.0 | 479.2 | 418.1 | 364.8 | 318.3 | 277.8 |
| Account Receivables, % | 34.52 | 28.66 | 41.96 | 24.46 | 53.66 | 36.65 | 36.65 | 36.65 | 36.65 | 36.65 |
| Inventories | 818.9 | 970.0 | 1,220.9 | 658.2 | 580.8 | 352.1 | 307.2 | 268.1 | 233.9 | 204.1 |
| Inventories, % | 22.59 | 25.19 | 31.99 | 16.12 | 38.76 | 26.93 | 26.93 | 26.93 | 26.93 | 26.93 |
| Accounts Payable | 282.2 | 984.5 | 809.9 | 360.7 | 357.2 | 228.1 | 199.1 | 173.7 | 151.6 | 132.2 |
| Accounts Payable, % | 7.79 | 25.57 | 21.22 | 8.83 | 23.84 | 17.45 | 17.45 | 17.45 | 17.45 | 17.45 |
| Capital Expenditure | -323.0 | -442.4 | -364.0 | -322.2 | -178.2 | -130.0 | -113.4 | -99.0 | -86.4 | -75.4 |
| Capital Expenditure, % | -8.91 | -11.49 | -9.54 | -7.89 | -11.89 | -9.94 | -9.94 | -9.94 | -9.94 | -9.94 |
| Tax Rate, % | 16 | 16 | 16 | 16 | 16 | 16 | 16 | 16 | 16 | 16 |
| EBITAT | 111.9 | 110.4 | -29.0 | 943.2 | -353.3 | -65.8 | -57.4 | -50.1 | -43.7 | -38.1 |
| Depreciation | ||||||||||
| Changes in Account Receivables | ||||||||||
| Changes in Inventories | ||||||||||
| Changes in Accounts Payable | ||||||||||
| Capital Expenditure | ||||||||||
| UFCF | -1,782.6 | 606.9 | -1,052.9 | 1,640.6 | -49.5 | 335.3 | -.9 | -.8 | -.7 | -.6 |
| WACC, % | 5.76 | 5.76 | 5.76 | 5.73 | 5.76 | 5.75 | 5.75 | 5.75 | 5.75 | 5.75 |
| PV UFCF | ||||||||||
| SUM PV UFCF | 314.5 | |||||||||
| Long Term Growth Rate, % | 3.50 | |||||||||
| Free cash flow (T + 1) | -1 | |||||||||
| Terminal Value | -28 | |||||||||
| Present Terminal Value | -22 | |||||||||
| Enterprise Value | 293 | |||||||||
| Net Debt | -1,648 | |||||||||
| Equity Value | 1,941 | |||||||||
| Diluted Shares Outstanding, MM | 538 | |||||||||
| Equity Value Per Share | 3.61 |
What You Will Receive
- Customizable Excel Template: A fully editable Excel-based DCF Calculator featuring pre-filled real BDStar financials.
- Actual Data: Access to historical figures and future estimates (highlighted in the yellow cells).
- Flexible Projections: Adjust forecast parameters such as revenue growth, EBITDA margin, and WACC.
- Instant Calculations: Quickly observe how your inputs affect the valuation of BDStar.
- Professional Resource: Designed for investors, CFOs, consultants, and financial analysts.
- Intuitive Layout: Organized for clarity and ease of navigation, complete with step-by-step guidance.
Key Features
- Accurate Financial Data: Gain access to reliable historical performance and future forecasts for Beijing BDStar Navigation Co., Ltd. (002151SZ).
- Adjustable Forecast Parameters: Modify the highlighted cells for key metrics like WACC, growth rates, and profit margins.
- Real-Time Calculations: Benefit from automatic updates to DCF, Net Present Value (NPV), and cash flow evaluations.
- User-Friendly Dashboard: Navigate through clear charts and summaries to effectively visualize your valuation findings.
- Designed for All Users: An intuitive layout suitable for investors, CFOs, and consultants, whether seasoned or new to the field.
How It Functions
- Step 1: Download the Excel template.
- Step 2: Examine the pre-filled financial information and projections for Beijing BDStar Navigation Co., Ltd. (002151SZ).
- Step 3: Adjust key parameters such as revenue growth, WACC, and tax rates (highlighted cells).
- Step 4: Observe the DCF model refresh in real-time as you modify your inputs.
- Step 5: Evaluate the results and utilize them for your investment strategies.
Why Opt for This Calculator?
- Designed for Experts: A sophisticated tool tailored for analysts, CFOs, and consultants.
- Accurate Financial Data: Beijing BDStar Navigation Co., Ltd.'s historical and projected financials are preloaded for precision.
- Flexible Scenario Analysis: Effortlessly simulate various forecasts and assumptions.
- Comprehensive Outputs: Automatically computes intrinsic value, NPV, and essential metrics.
- User-Friendly: Clear, step-by-step instructions will guide you throughout the process.
Who Can Benefit from This Product?
- Students in Navigation and Geospatial Sciences: Discover navigation techniques and apply them to real-world scenarios.
- Researchers: Integrate advanced models into your studies or research projects.
- Investors: Evaluate your investment theories and assess the performance of Beijing BDStar Navigation Co., Ltd. (002151SZ).
- Market Analysts: Enhance your analysis process with a ready-to-use, customizable DCF model.
- Entrepreneurs: Learn how major navigation companies like Beijing BDStar Navigation Co., Ltd. (002151SZ) are assessed in the market.
Contents of the Template
- Pre-Filled Data: Contains historical financials and projections for Beijing BDStar Navigation Co., Ltd. (002151SZ).
- Discounted Cash Flow Model: An editable DCF valuation model featuring automated calculations.
- Weighted Average Cost of Capital (WACC): A dedicated sheet for WACC calculation using personalized inputs.
- Key Financial Ratios: Evaluate profitability, efficiency, and leverage for Beijing BDStar Navigation Co., Ltd. (002151SZ).
- Customizable Inputs: Easily modify revenue growth rates, margins, and tax rates.
- Clear Dashboard: Visual representations such as charts and tables to summarize essential valuation outcomes.
Disclaimer
All information, articles, and product details provided on this website are for general informational and educational purposes only. We do not claim any ownership over, nor do we intend to infringe upon, any trademarks, copyrights, logos, brand names, or other intellectual property mentioned or depicted on this site. Such intellectual property remains the property of its respective owners, and any references here are made solely for identification or informational purposes, without implying any affiliation, endorsement, or partnership.
We make no representations or warranties, express or implied, regarding the accuracy, completeness, or suitability of any content or products presented. Nothing on this website should be construed as legal, tax, investment, financial, medical, or other professional advice. In addition, no part of this site—including articles or product references—constitutes a solicitation, recommendation, endorsement, advertisement, or offer to buy or sell any securities, franchises, or other financial instruments, particularly in jurisdictions where such activity would be unlawful.
All content is of a general nature and may not address the specific circumstances of any individual or entity. It is not a substitute for professional advice or services. Any actions you take based on the information provided here are strictly at your own risk. You accept full responsibility for any decisions or outcomes arising from your use of this website and agree to release us from any liability in connection with your use of, or reliance upon, the content or products found herein.