
|
Avic Jonhon Optronic Technology Co., Ltd. (002179.SZ) Évaluation DCF |
Entièrement Modifiable: Adapté À Vos Besoins Dans Excel Ou Sheets
Conception Professionnelle: Modèles Fiables Et Conformes Aux Normes Du Secteur
Pré-Construits Pour Une Utilisation Rapide Et Efficace
Compatible MAC/PC, entièrement débloqué
Aucune Expertise N'Est Requise; Facile À Suivre
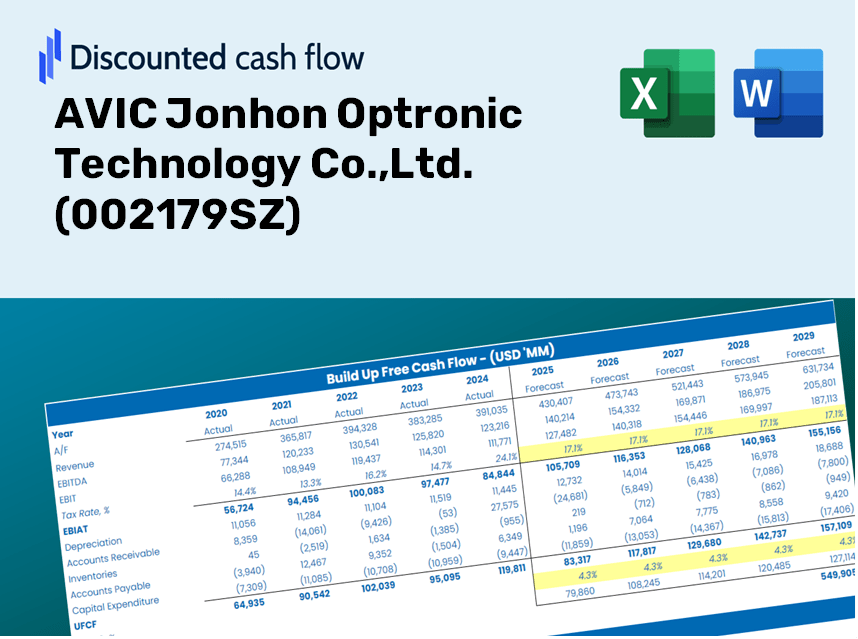
AVIC Jonhon Optronic Technology Co.,Ltd. (002179.SZ) Bundle
Vous souhaitez estimer Avic Jonhon Optronic Technology Co., Ltd. valeur intrinsèque? Notre calculatrice DCF (002179SZ) fusionne les données du monde réel avec des options de personnalisation complètes, vous permettant d'ajuster les prévisions et de faire des choix d'investissement plus éclairés.
Discounted Cash Flow (DCF) - (USD MM)
| Year | AY1 2020 |
AY2 2021 |
AY3 2022 |
AY4 2023 |
AY5 2024 |
FY1 2025 |
FY2 2026 |
FY3 2027 |
FY4 2028 |
FY5 2029 |
|---|---|---|---|---|---|---|---|---|---|---|
| Revenue | 10,305.2 | 12,866.9 | 15,838.1 | 20,074.4 | 20,685.5 | 24,705.9 | 29,507.5 | 35,242.5 | 42,092.0 | 50,272.7 |
| Revenue Growth, % | 0 | 24.86 | 23.09 | 26.75 | 3.04 | 19.44 | 19.44 | 19.44 | 19.44 | 19.44 |
| EBITDA | 1,855.7 | 2,481.4 | 2,924.9 | 3,697.9 | 4,086.9 | 4,641.6 | 5,543.7 | 6,621.2 | 7,908.1 | 9,445.0 |
| EBITDA, % | 18.01 | 19.29 | 18.47 | 18.42 | 19.76 | 18.79 | 18.79 | 18.79 | 18.79 | 18.79 |
| Depreciation | 202.5 | 240.2 | 312.2 | 394.0 | 525.6 | 509.3 | 608.2 | 726.5 | 867.7 | 1,036.3 |
| Depreciation, % | 1.96 | 1.87 | 1.97 | 1.96 | 2.54 | 2.06 | 2.06 | 2.06 | 2.06 | 2.06 |
| EBIT | 1,653.2 | 2,241.2 | 2,612.6 | 3,303.9 | 3,561.3 | 4,132.4 | 4,935.5 | 5,894.7 | 7,040.4 | 8,408.7 |
| EBIT, % | 16.04 | 17.42 | 16.5 | 16.46 | 17.22 | 16.73 | 16.73 | 16.73 | 16.73 | 16.73 |
| Total Cash | 4,581.4 | 8,304.7 | 9,953.3 | 9,887.3 | 9,166.5 | 13,114.4 | 15,663.3 | 18,707.5 | 22,343.4 | 26,685.9 |
| Total Cash, percent | .0 | .0 | .0 | .0 | .0 | .0 | .0 | .0 | .0 | .0 |
| Account Receivables | 8,470.9 | 9,353.6 | 10,359.6 | 13,208.2 | 16,785.3 | 18,146.3 | 21,673.1 | 25,885.3 | 30,916.3 | 36,925.0 |
| Account Receivables, % | 82.2 | 72.7 | 65.41 | 65.8 | 81.15 | 73.45 | 73.45 | 73.45 | 73.45 | 73.45 |
| Inventories | 2,791.9 | 4,729.8 | 5,416.0 | 4,189.7 | 4,699.4 | 6,998.5 | 8,358.7 | 9,983.3 | 11,923.6 | 14,240.9 |
| Inventories, % | 27.09 | 36.76 | 34.2 | 20.87 | 22.72 | 28.33 | 28.33 | 28.33 | 28.33 | 28.33 |
| Accounts Payable | 5,519.3 | 7,264.7 | 7,657.3 | 8,594.0 | 11,887.6 | 12,780.1 | 15,264.0 | 18,230.6 | 21,773.8 | 26,005.6 |
| Accounts Payable, % | 53.56 | 56.46 | 48.35 | 42.81 | 57.47 | 51.73 | 51.73 | 51.73 | 51.73 | 51.73 |
| Capital Expenditure | -393.4 | -1,118.8 | -1,517.2 | -2,393.7 | -1,542.8 | -2,049.3 | -2,447.6 | -2,923.3 | -3,491.5 | -4,170.1 |
| Capital Expenditure, % | -3.82 | -8.7 | -9.58 | -11.92 | -7.46 | -8.29 | -8.29 | -8.29 | -8.29 | -8.29 |
| Tax Rate, % | 10.89 | 10.89 | 10.89 | 10.89 | 10.89 | 10.89 | 10.89 | 10.89 | 10.89 | 10.89 |
| EBITAT | 1,415.2 | 1,967.9 | 2,325.1 | 2,954.8 | 3,173.5 | 3,644.3 | 4,352.6 | 5,198.6 | 6,209.0 | 7,415.7 |
| Depreciation | ||||||||||
| Changes in Account Receivables | ||||||||||
| Changes in Inventories | ||||||||||
| Changes in Accounts Payable | ||||||||||
| Capital Expenditure | ||||||||||
| UFCF | -4,519.2 | 14.1 | -179.3 | 269.4 | 1,363.2 | -663.3 | 110.1 | 131.5 | 157.1 | 187.6 |
| WACC, % | 5.27 | 5.27 | 5.28 | 5.28 | 5.28 | 5.27 | 5.27 | 5.27 | 5.27 | 5.27 |
| PV UFCF | ||||||||||
| SUM PV UFCF | -145.0 | |||||||||
| Long Term Growth Rate, % | 3.50 | |||||||||
| Free cash flow (T + 1) | 194 | |||||||||
| Terminal Value | 10,942 | |||||||||
| Present Terminal Value | 8,462 | |||||||||
| Enterprise Value | 8,317 | |||||||||
| Net Debt | -7,882 | |||||||||
| Equity Value | 16,199 | |||||||||
| Diluted Shares Outstanding, MM | 2,124 | |||||||||
| Equity Value Per Share | 7.63 |
What You Will Receive
- Comprehensive AVIC Jonhon Financials: Access to historical and projected data for precise valuation.
- Customizable Inputs: Adjust WACC, tax rates, revenue growth, and capital expenditures as needed.
- Instantaneous Calculations: Intrinsic value and NPV are calculated in real-time.
- Scenario Analysis: Explore various scenarios to assess AVIC Jonhon's potential performance.
- User-Friendly Design: Designed for professionals while remaining accessible to newcomers.
Key Features
- Real-Time AVIC Jonhon Data: Pre-loaded with the company's historical financial performance and future projections.
- Comprehensive Customization Options: Tailor revenue growth, profit margins, WACC, tax rates, and capital expenditures to your needs.
- Interactive Valuation Model: Automatic recalculations of Net Present Value (NPV) and intrinsic value as you modify inputs.
- Scenario Analysis: Generate various forecasting scenarios to assess different valuation paths.
- Intuitive User Interface: Designed for ease of use, suitable for both industry professionals and novices.
How It Works
- Download: Get the comprehensive Excel file containing AVIC Jonhon Optronic Technology Co.,Ltd.'s (002179SZ) financial data.
- Customize: Modify forecasts such as revenue growth, EBITDA %, and WACC to fit your analysis.
- Update Automatically: Witness real-time updates for intrinsic value and NPV calculations as you make changes.
- Test Scenarios: Generate various projections and analyze different outcomes instantly.
- Make Decisions: Leverage the valuation results to shape your investment approach.
Why Opt for This Calculator?
- Designed for Experts: A sophisticated tool favored by analysts, CFOs, and consultants in the industry.
- Accurate Data: AVIC Jonhon Optronic Technology Co.,Ltd.'s historical and projected financials are preloaded for reliability.
- Flexible Scenario Analysis: Easily explore various forecasts and assumptions to find the best outcomes.
- Concise Results: Automatically computes intrinsic value, NPV, and essential metrics.
- User-Friendly: Detailed instructions guide you step-by-step through the calculation process.
Who Can Benefit from AVIC Jonhon Optronic Technology Co., Ltd. (002179SZ)?
- Investors: Make informed investment choices using our advanced valuation tools tailored for precision.
- Financial Analysts: Enhance your workflow with our customizable DCF models, designed for efficiency.
- Consultants: Effortlessly modify templates for impactful client presentations and comprehensive reports.
- Finance Enthusiasts: Expand your knowledge of valuation strategies through practical, real-world case studies.
- Educators and Students: Utilize our resources as hands-on learning aids in finance courses and workshops.
Contents of the Template
- Historical Data: Contains AVIC Jonhon Optronic Technology Co.,Ltd.'s past financial performance and baseline projections.
- DCF and Levered DCF Models: Comprehensive templates for calculating the intrinsic value of AVIC Jonhon Optronic Technology Co.,Ltd. (002179SZ).
- WACC Sheet: Pre-configured calculations for the Weighted Average Cost of Capital.
- Editable Inputs: Customize essential drivers such as growth rates, EBITDA %, and CAPEX assumptions.
- Quarterly and Annual Statements: A thorough analysis of AVIC Jonhon Optronic Technology Co.,Ltd.'s financial statements.
- Interactive Dashboard: Dynamically visualize valuation outcomes and projections.
Disclaimer
All information, articles, and product details provided on this website are for general informational and educational purposes only. We do not claim any ownership over, nor do we intend to infringe upon, any trademarks, copyrights, logos, brand names, or other intellectual property mentioned or depicted on this site. Such intellectual property remains the property of its respective owners, and any references here are made solely for identification or informational purposes, without implying any affiliation, endorsement, or partnership.
We make no representations or warranties, express or implied, regarding the accuracy, completeness, or suitability of any content or products presented. Nothing on this website should be construed as legal, tax, investment, financial, medical, or other professional advice. In addition, no part of this site—including articles or product references—constitutes a solicitation, recommendation, endorsement, advertisement, or offer to buy or sell any securities, franchises, or other financial instruments, particularly in jurisdictions where such activity would be unlawful.
All content is of a general nature and may not address the specific circumstances of any individual or entity. It is not a substitute for professional advice or services. Any actions you take based on the information provided here are strictly at your own risk. You accept full responsibility for any decisions or outcomes arising from your use of this website and agree to release us from any liability in connection with your use of, or reliance upon, the content or products found herein.