
|
Nanjing Yunhai Special Metals Co., Ltd. (002182.SZ) Valation DCF |
Entièrement Modifiable: Adapté À Vos Besoins Dans Excel Ou Sheets
Conception Professionnelle: Modèles Fiables Et Conformes Aux Normes Du Secteur
Pré-Construits Pour Une Utilisation Rapide Et Efficace
Compatible MAC/PC, entièrement débloqué
Aucune Expertise N'Est Requise; Facile À Suivre
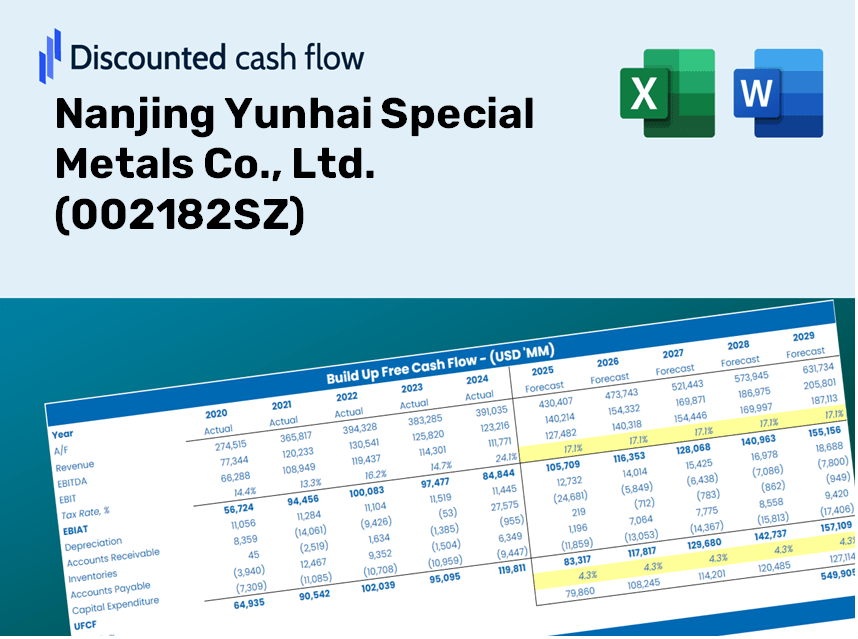
Nanjing Yunhai Special Metals Co., Ltd. (002182.SZ) Bundle
Rationalisez votre analyse et améliorez la précision avec notre calculatrice DCF (002182SZ)! En utilisant des données réelles de Nanjing Yunhai Special Metals Co., Ltd. et des hypothèses personnalisables, cet outil vous permet de prévoir, analyser et valoriser (002182SZ) comme un investisseur chevronné.
Discounted Cash Flow (DCF) - (USD MM)
| Year | AY1 2020 |
AY2 2021 |
AY3 2022 |
AY4 2023 |
AY5 2024 |
FY1 2025 |
FY2 2026 |
FY3 2027 |
FY4 2028 |
FY5 2029 |
|---|---|---|---|---|---|---|---|---|---|---|
| Revenue | 5,945.5 | 8,116.6 | 9,104.6 | 7,651.8 | 8,982.6 | 10,108.2 | 11,374.8 | 12,800.1 | 14,404.1 | 16,209.0 |
| Revenue Growth, % | 0 | 36.52 | 12.17 | -15.96 | 17.39 | 12.53 | 12.53 | 12.53 | 12.53 | 12.53 |
| EBITDA | 512.6 | 815.5 | 1,098.9 | 782.1 | 673.9 | 979.7 | 1,102.5 | 1,240.7 | 1,396.1 | 1,571.1 |
| EBITDA, % | 8.62 | 10.05 | 12.07 | 10.22 | 7.5 | 9.69 | 9.69 | 9.69 | 9.69 | 9.69 |
| Depreciation | 176.3 | 194.7 | 253.8 | 297.9 | 405.2 | 334.7 | 376.6 | 423.8 | 477.0 | 536.7 |
| Depreciation, % | 2.97 | 2.4 | 2.79 | 3.89 | 4.51 | 3.31 | 3.31 | 3.31 | 3.31 | 3.31 |
| EBIT | 336.3 | 620.8 | 845.1 | 484.2 | 268.7 | 645.0 | 725.9 | 816.8 | 919.2 | 1,034.3 |
| EBIT, % | 5.66 | 7.65 | 9.28 | 6.33 | 2.99 | 6.38 | 6.38 | 6.38 | 6.38 | 6.38 |
| Total Cash | 244.2 | 244.3 | 274.5 | 372.7 | 245.2 | 358.5 | 403.4 | 454.0 | 510.9 | 574.9 |
| Total Cash, percent | .0 | .0 | .0 | .0 | .0 | .0 | .0 | .0 | .0 | .0 |
| Account Receivables | 1,684.0 | 2,239.6 | 1,963.2 | 2,175.3 | 2,645.0 | 2,736.4 | 3,079.3 | 3,465.1 | 3,899.3 | 4,387.9 |
| Account Receivables, % | 28.32 | 27.59 | 21.56 | 28.43 | 29.45 | 27.07 | 27.07 | 27.07 | 27.07 | 27.07 |
| Inventories | 807.6 | 1,103.5 | 1,348.6 | 1,258.2 | 1,488.0 | 1,516.2 | 1,706.2 | 1,920.0 | 2,160.6 | 2,431.4 |
| Inventories, % | 13.58 | 13.6 | 14.81 | 16.44 | 16.57 | 15 | 15 | 15 | 15 | 15 |
| Accounts Payable | 759.5 | 942.4 | 944.6 | 767.3 | 996.0 | 1,129.6 | 1,271.1 | 1,430.4 | 1,609.7 | 1,811.4 |
| Accounts Payable, % | 12.77 | 11.61 | 10.38 | 10.03 | 11.09 | 11.18 | 11.18 | 11.18 | 11.18 | 11.18 |
| Capital Expenditure | -409.8 | -839.2 | -1,327.6 | -1,892.7 | -1,790.0 | -1,546.1 | -1,739.8 | -1,957.8 | -2,203.1 | -2,479.2 |
| Capital Expenditure, % | -6.89 | -10.34 | -14.58 | -24.74 | -19.93 | -15.3 | -15.3 | -15.3 | -15.3 | -15.3 |
| Tax Rate, % | 14.73 | 14.73 | 14.73 | 14.73 | 14.73 | 14.73 | 14.73 | 14.73 | 14.73 | 14.73 |
| EBITAT | 290.5 | 526.5 | 660.2 | 394.6 | 229.1 | 536.7 | 604.0 | 679.7 | 764.9 | 860.7 |
| Depreciation | ||||||||||
| Changes in Account Receivables | ||||||||||
| Changes in Inventories | ||||||||||
| Changes in Accounts Payable | ||||||||||
| Capital Expenditure | ||||||||||
| UFCF | -1,675.2 | -786.6 | -380.1 | -1,499.2 | -1,626.5 | -660.6 | -1,150.5 | -1,294.7 | -1,456.9 | -1,639.5 |
| WACC, % | 5.11 | 5.09 | 5.03 | 5.06 | 5.1 | 5.08 | 5.08 | 5.08 | 5.08 | 5.08 |
| PV UFCF | ||||||||||
| SUM PV UFCF | -5,261.5 | |||||||||
| Long Term Growth Rate, % | 3.50 | |||||||||
| Free cash flow (T + 1) | -1,697 | |||||||||
| Terminal Value | -107,567 | |||||||||
| Present Terminal Value | -83,971 | |||||||||
| Enterprise Value | -89,233 | |||||||||
| Net Debt | 4,709 | |||||||||
| Equity Value | -93,942 | |||||||||
| Diluted Shares Outstanding, MM | 991 | |||||||||
| Equity Value Per Share | -94.75 |
What You Will Receive
- Authentic Nanjing Yunhai Data: Comprehensive financials – covering revenue to EBIT – based on both actual and anticipated figures.
- Complete Customization: Modify all essential parameters (yellow cells) such as WACC, growth percentage, and tax rates.
- Immediate Valuation Adjustments: Automatic recalculations to assess the effects of changes on the fair value of Nanjing Yunhai Special Metals (002182SZ).
- Flexible Excel Template: Designed for easy modifications, scenario simulations, and in-depth projections.
- Efficient and Precise: Avoid the hassle of creating models from the ground up while ensuring accuracy and adaptability.
Key Features
- Customizable Forecast Inputs: Adjust essential factors such as revenue growth, EBITDA margins, and capital investment.
- Instant DCF Valuation: Quickly determines intrinsic value, NPV, and other financial metrics.
- High-Precision Analytics: Leverages Nanjing Yunhai Special Metals Co., Ltd.'s (002182SZ) actual financial data for accurate valuation results.
- Effortless Scenario Analysis: Easily explore various assumptions and evaluate their impacts side by side.
- Efficiency Booster: Remove the complexity of creating intricate valuation models from the ground up.
How It Works
- Download the Template: Gain immediate access to the Excel-based Nanjing Yunhai Special Metals Co., Ltd. DCF Calculator (002182SZ).
- Input Your Assumptions: Modify the yellow-highlighted cells for growth rates, WACC, profit margins, and additional factors.
- Instant Calculations: The model will automatically refresh Nanjing Yunhai’s intrinsic value.
- Test Scenarios: Experiment with various assumptions to see how they affect the valuation.
- Analyze and Decide: Leverage the insights to inform your investment or financial evaluations.
Why Select This Calculator for Nanjing Yunhai Special Metals Co., Ltd. (002182SZ)?
- Designed for Industry Experts: A sophisticated tool tailored for professionals, including analysts, CFOs, and consultants.
- Accurate Data Integration: Historical and projected financials of Nanjing Yunhai Special Metals preloaded for precision.
- Flexible Scenario Analysis: Easily simulate various forecasts and assumptions for better insights.
- Concise Results: Instantly computes intrinsic value, NPV, and other essential metrics.
- User-Friendly Interface: Step-by-step instructions simplify your navigation through the tool.
Who Can Benefit from This Product?
- Finance Students: Master valuation strategies and apply them to real-world data for Nanjing Yunhai Special Metals Co., Ltd. (002182SZ).
- Researchers: Integrate advanced models into academic studies or projects focused on metals and materials.
- Investors: Validate your investment hypotheses and assess valuation trends for Nanjing Yunhai Special Metals Co., Ltd. (002182SZ).
- Market Analysts: Enhance your analysis with a customizable DCF model tailored for the metals industry.
- Entrepreneurs: Discover how publicly traded companies like Nanjing Yunhai Special Metals Co., Ltd. (002182SZ) are evaluated in the market.
Contents of the Template
- Pre-Filled Data: Contains historical financials and forecasts for Nanjing Yunhai Special Metals Co., Ltd. (002182SZ).
- Discounted Cash Flow Model: An editable DCF valuation model featuring automatic calculations.
- Weighted Average Cost of Capital (WACC): A specific sheet for WACC calculations based on user-defined inputs.
- Key Financial Ratios: Evaluate Nanjing Yunhai's profitability, efficiency, and leverage metrics.
- Customizable Inputs: Easily modify revenue growth, profit margins, and tax rates.
- Comprehensive Dashboard: Visual charts and tables that summarize essential valuation outcomes.
Disclaimer
All information, articles, and product details provided on this website are for general informational and educational purposes only. We do not claim any ownership over, nor do we intend to infringe upon, any trademarks, copyrights, logos, brand names, or other intellectual property mentioned or depicted on this site. Such intellectual property remains the property of its respective owners, and any references here are made solely for identification or informational purposes, without implying any affiliation, endorsement, or partnership.
We make no representations or warranties, express or implied, regarding the accuracy, completeness, or suitability of any content or products presented. Nothing on this website should be construed as legal, tax, investment, financial, medical, or other professional advice. In addition, no part of this site—including articles or product references—constitutes a solicitation, recommendation, endorsement, advertisement, or offer to buy or sell any securities, franchises, or other financial instruments, particularly in jurisdictions where such activity would be unlawful.
All content is of a general nature and may not address the specific circumstances of any individual or entity. It is not a substitute for professional advice or services. Any actions you take based on the information provided here are strictly at your own risk. You accept full responsibility for any decisions or outcomes arising from your use of this website and agree to release us from any liability in connection with your use of, or reliance upon, the content or products found herein.