
|
Costar Group Co., Ltd. (002189.SZ) Évaluation DCF |
Entièrement Modifiable: Adapté À Vos Besoins Dans Excel Ou Sheets
Conception Professionnelle: Modèles Fiables Et Conformes Aux Normes Du Secteur
Pré-Construits Pour Une Utilisation Rapide Et Efficace
Compatible MAC/PC, entièrement débloqué
Aucune Expertise N'Est Requise; Facile À Suivre
Costar Group Co., Ltd. (002189.SZ) Bundle
Conçu pour la précision, notre calculatrice DCF (002189SZ) vous permet d'évaluer l'évaluation de Costar Group Co., Ltd. à l'aide de données financières authentiques, tout en offrant une flexibilité complète pour modifier tous les paramètres essentiels pour améliorer les prévisions.
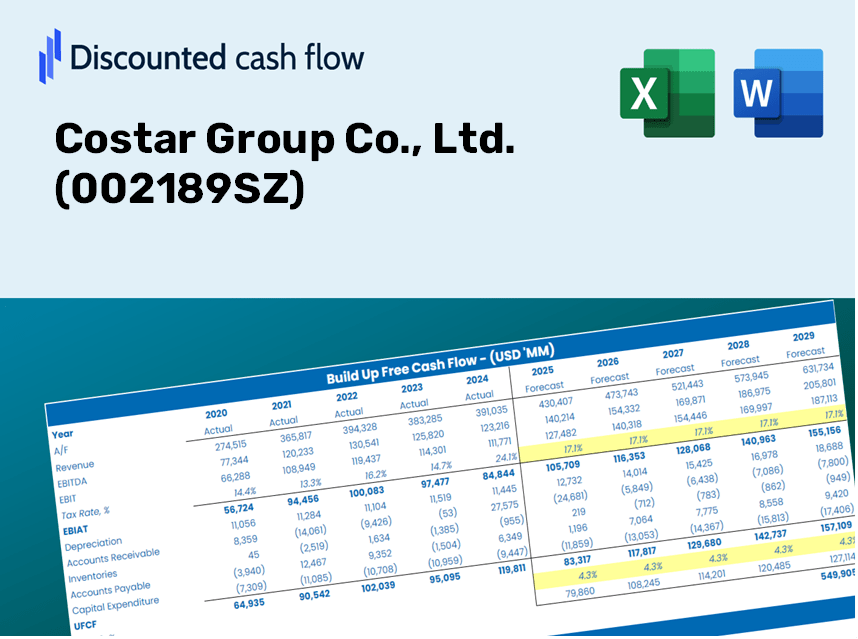
Discounted Cash Flow (DCF) - (USD MM)
| Year | AY1 2020 |
AY2 2021 |
AY3 2022 |
AY4 2023 |
AY5 2024 |
FY1 2025 |
FY2 2026 |
FY3 2027 |
FY4 2028 |
FY5 2029 |
|---|---|---|---|---|---|---|---|---|---|---|
| Revenue | 3,333.0 | 4,128.8 | 3,285.1 | 2,173.5 | 1,785.1 | 1,569.7 | 1,380.3 | 1,213.7 | 1,067.3 | 938.5 |
| Revenue Growth, % | 0 | 23.88 | -20.43 | -33.84 | -17.87 | -12.07 | -12.07 | -12.07 | -12.07 | -12.07 |
| EBITDA | 217.4 | 264.5 | -73.2 | -177.5 | -250.1 | -36.0 | -31.7 | -27.9 | -24.5 | -21.5 |
| EBITDA, % | 6.52 | 6.41 | -2.23 | -8.17 | -14.01 | -2.29 | -2.29 | -2.29 | -2.29 | -2.29 |
| Depreciation | 60.7 | 75.2 | 80.3 | 81.1 | 108.3 | 49.9 | 43.8 | 38.6 | 33.9 | 29.8 |
| Depreciation, % | 1.82 | 1.82 | 2.44 | 3.73 | 6.07 | 3.18 | 3.18 | 3.18 | 3.18 | 3.18 |
| EBIT | 156.8 | 189.3 | -153.4 | -258.6 | -358.4 | -85.9 | -75.5 | -66.4 | -58.4 | -51.4 |
| EBIT, % | 4.7 | 4.59 | -4.67 | -11.9 | -20.08 | -5.47 | -5.47 | -5.47 | -5.47 | -5.47 |
| Total Cash | 925.1 | 979.6 | 656.0 | 405.5 | 309.9 | 337.4 | 296.7 | 260.9 | 229.4 | 201.7 |
| Total Cash, percent | .0 | .0 | .0 | .0 | .0 | .0 | .0 | .0 | .0 | .0 |
| Account Receivables | 971.9 | 905.6 | 1,298.6 | 905.3 | 887.8 | 571.4 | 502.4 | 441.8 | 388.5 | 341.6 |
| Account Receivables, % | 29.16 | 21.93 | 39.53 | 41.65 | 49.74 | 36.4 | 36.4 | 36.4 | 36.4 | 36.4 |
| Inventories | 547.7 | 605.8 | 453.3 | 326.3 | 357.7 | 251.0 | 220.7 | 194.1 | 170.7 | 150.1 |
| Inventories, % | 16.43 | 14.67 | 13.8 | 15.01 | 20.04 | 15.99 | 15.99 | 15.99 | 15.99 | 15.99 |
| Accounts Payable | 759.2 | 1,143.2 | 848.7 | 691.4 | 826.5 | 484.7 | 426.3 | 374.8 | 329.6 | 289.8 |
| Accounts Payable, % | 22.78 | 27.69 | 25.84 | 31.81 | 46.3 | 30.88 | 30.88 | 30.88 | 30.88 | 30.88 |
| Capital Expenditure | -131.2 | -234.9 | -168.6 | -164.1 | -100.4 | -87.7 | -77.1 | -67.8 | -59.6 | -52.4 |
| Capital Expenditure, % | -3.94 | -5.69 | -5.13 | -7.55 | -5.62 | -5.59 | -5.59 | -5.59 | -5.59 | -5.59 |
| Tax Rate, % | 4.06 | 4.06 | 4.06 | 4.06 | 4.06 | 4.06 | 4.06 | 4.06 | 4.06 | 4.06 |
| EBITAT | 158.3 | 166.5 | -150.2 | -217.7 | -343.9 | -80.0 | -70.4 | -61.9 | -54.4 | -47.8 |
| Depreciation | ||||||||||
| Changes in Account Receivables | ||||||||||
| Changes in Inventories | ||||||||||
| Changes in Accounts Payable | ||||||||||
| Capital Expenditure | ||||||||||
| UFCF | -672.7 | 399.0 | -773.5 | 62.2 | -214.7 | -36.5 | -62.9 | -55.3 | -48.6 | -42.8 |
| WACC, % | 7.25 | 7.19 | 7.24 | 7.17 | 7.23 | 7.22 | 7.22 | 7.22 | 7.22 | 7.22 |
| PV UFCF | ||||||||||
| SUM PV UFCF | -200.5 | |||||||||
| Long Term Growth Rate, % | 3.00 | |||||||||
| Free cash flow (T + 1) | -44 | |||||||||
| Terminal Value | -1,044 | |||||||||
| Present Terminal Value | -736 | |||||||||
| Enterprise Value | -937 | |||||||||
| Net Debt | 656 | |||||||||
| Equity Value | -1,593 | |||||||||
| Diluted Shares Outstanding, MM | 261 | |||||||||
| Equity Value Per Share | -6.10 |
What You Will Receive
- Genuine Costar Data: Preloaded financials – encompassing everything from revenue to EBIT – derived from real and projected statistics.
- Comprehensive Customization: Modify all essential parameters (yellow cells) such as WACC, growth %, and tax liabilities.
- Immediate Valuation Adjustments: Automatic recalculations to assess the effects of changes on Costar’s fair value.
- Adaptable Excel Template: Designed for quick modifications, scenario analysis, and in-depth forecasts.
- Efficient and Precise: Avoid the hassle of building models from the ground up while ensuring accuracy and adaptability.
Key Features
- Customizable Forecast Inputs: Adjust essential metrics such as revenue growth, EBITDA %, and capital expenditures with ease.
- Instant DCF Valuation: Quickly computes intrinsic value, NPV, and additional outputs at the click of a button.
- Industry-Leading Precision: Leverages Costar Group's real-world financial data for accurate valuation results.
- Simplified Scenario Analysis: Effortlessly evaluate various assumptions and analyze different outcomes.
- Efficiency Boost: Remove the need for creating intricate valuation models from the ground up.
How It Functions
- Download: Obtain the pre-formatted Excel file containing Costar Group Co., Ltd.'s financial data.
- Customize: Modify projections, such as revenue growth, EBITDA %, and WACC.
- Update Automatically: The intrinsic value and NPV calculations refresh in real-time.
- Test Scenarios: Generate multiple forecasts and evaluate results instantly.
- Make Decisions: Leverage the valuation insights to inform your investment strategy.
Why Select Costar Group Co., Ltd. (002189SZ) Calculator?
- Precision: Utilizes authentic Costar financial data for optimal accuracy.
- Versatility: Built for users to easily experiment and adjust inputs.
- Efficiency: Eliminate the need to create a DCF model from the ground up.
- High-Quality: Crafted with the attention to detail expected by CFOs and financial experts.
- Intuitive: Simple enough for anyone, regardless of financial modeling expertise, to navigate effortlessly.
Who Can Benefit from Our Services?
- Finance Students: Master valuation methods and practice with real-world data specific to Costar Group Co., Ltd. (002189SZ).
- Academics: Enhance your curriculum or research by integrating industry-standard models related to Costar Group Co., Ltd. (002189SZ).
- Investors: Evaluate your own hypotheses and assess valuation results for Costar Group Co., Ltd. (002189SZ).
- Analysts: Improve your efficiency with a ready-to-use, adaptable DCF model tailored for Costar Group Co., Ltd. (002189SZ).
- Small Business Owners: Discover how major companies, such as Costar Group Co., Ltd. (002189SZ), are evaluated in the market.
Contents of the Template
- Thorough DCF Model: An editable template featuring comprehensive valuation calculations.
- Real-World Data: Historical and projected financials for Costar Group Co., Ltd. (002189SZ) preloaded for in-depth analysis.
- Customizable Parameters: Modify WACC, growth rates, and tax assumptions to explore various scenarios.
- Financial Statements: Complete annual and quarterly breakdowns to provide deeper insights.
- Key Ratios: Integrated analysis covering profitability, efficiency, and leverage metrics.
- Dashboard with Visual Outputs: Visualizations such as charts and tables for clear, actionable insights.
Disclaimer
All information, articles, and product details provided on this website are for general informational and educational purposes only. We do not claim any ownership over, nor do we intend to infringe upon, any trademarks, copyrights, logos, brand names, or other intellectual property mentioned or depicted on this site. Such intellectual property remains the property of its respective owners, and any references here are made solely for identification or informational purposes, without implying any affiliation, endorsement, or partnership.
We make no representations or warranties, express or implied, regarding the accuracy, completeness, or suitability of any content or products presented. Nothing on this website should be construed as legal, tax, investment, financial, medical, or other professional advice. In addition, no part of this site—including articles or product references—constitutes a solicitation, recommendation, endorsement, advertisement, or offer to buy or sell any securities, franchises, or other financial instruments, particularly in jurisdictions where such activity would be unlawful.
All content is of a general nature and may not address the specific circumstances of any individual or entity. It is not a substitute for professional advice or services. Any actions you take based on the information provided here are strictly at your own risk. You accept full responsibility for any decisions or outcomes arising from your use of this website and agree to release us from any liability in connection with your use of, or reliance upon, the content or products found herein.